
Essentials Of Investments
11th Edition
ISBN: 9781260013924
Author: Bodie, Zvi, Kane, Alex, MARCUS, Alan J.
Publisher: Mcgraw-hill Education,
expand_more
expand_more
format_list_bulleted
Related questions
Question
Pakodi
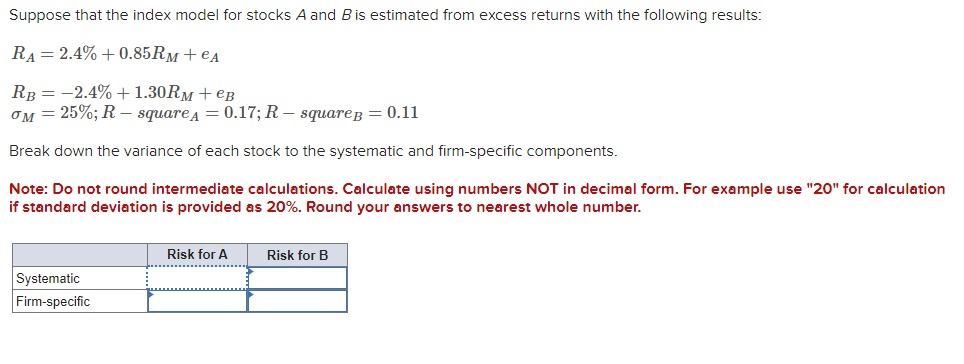

Transcribed Image Text:Suppose that the index model for stocks A and B is estimated from excess returns with the following results:
RA 2.4%+0.85Rм+ еA
=
RB -2.4% +1.30Rм + еB
=
σM = 25%; R-squareA = 0.17; R-square B = 0.11
Break down the variance of each stock to the systematic and firm-specific components.
Note: Do not round intermediate calculations. Calculate using numbers NOT in decimal form. For example use "20" for calculation
if standard deviation is provided as 20%. Round your answers to nearest whole number.
Systematic
Firm-specific
Risk for A
Risk for B
Expert Solution
This question has been solved!
Explore an expertly crafted, step-by-step solution for a thorough understanding of key concepts.

Step by stepSolved in 2 steps

Knowledge Booster

Similar questions
- Suppose that the index model for stocks A and B is estimated from excess returns with the following results: RA = 2.5% + 0.95RM + eA RB = -1.8% + 1.10RM + eB OM = 27%; R-squareд = 0.23; R-squareB = 0.11 Break down the variance of each stock to the systematic and firm-specific components. Note: Do not round intermediate calculations. Calculate using numbers in decimal form, not percentages. For example use "20" for calculation if standard deviation is provided as 20%. Round your answers to nearest whole number. Systematic Firm-specific Risk for A Risk for Barrow_forwardSuppose that the index model for stocks A and B is estimated from excess returns with the following results: RA = 5.0% +1.30RM + еA RB = -2.0% + 1.60RM + еB ом = 20%; R-squareд = 0.20; R-squareB 0.12 = Break down the variance of each stock to the systematic and firm-specific components. Note: Do not round intermediate calculations. Calculate using numbers in decimal form, not percentages. For example use "20" for calculation if standard deviation is provided as 20%. Round your answers to nearest whole number. Systematic Firm-specific Risk for A Risk for B 0 0 0 1arrow_forwardSuppose that the index model for stocks A and B is estimated from excess returns with the following results: RA= 3.6 % + 1.20RM + eA RB = -1.6 % +1.50RM + eg OM = 16%; R-squareA = 0.25; R-squareg = 0.15 Break down the variance of each stock to the systematic and firm-specific components. (Do not round intermediate calculations. Calculate using numbers in decimal form, not percentages. Round your answers to 4 decimal places.) Risk for A Risk for B Systematic Firm-specificarrow_forward
- Suppose that the index model for stocks A and B is estimated from excess returns with the following results: RA 3.2% + 1.10RM + EA RB = -1.4% + 1.25RM + eB OM = 30%; R-squarea = 0.28; R-squareB = 0.12 Break down the variance of each stock to the systematic and firm-specific components. (Do not round intermediate calculations. Calculate using numbers in decimal form, not percentages. Round your answers to 4 decimal places.) Risk for A Risk for B Systematic Firm-specificarrow_forwardSuppose the index model for stocks A and B is estimated with the following results:rA = 2% + 0.8RM + eA, rB = 2% + 1.2RM + eB , σM = 20%, and RM = rM − rf . The regressionR2 of stocks A and B is 0.40 and 0.30, respectively.(a) What is the variance of each stock? (b) What is the firm-specific risk of each stock? (c) What is the covariance between the two stocks?arrow_forwardSuppose that the index model for stocks A and B is estimated from excess returns with the following results:RA = 3% + .7RM + eARB = −2% + 1.2RM + eBσM = 20%; R-squareA = .20; R-squareB = .12Break down the variance of each stock into its systematic and firm-specific components.arrow_forward
- Suppose that the index model for stocks A and B is estimated from excess returns with the following results: RA= 4.0% + 0.50RM + eA RB= -1.2% + 0.7RM + eB sigmaM= 17% ; R-squareA = 0.26 ; R-squareB= 0.18 Break down the variance of each stock to the systematic and firm-specific components (write in decimal form, rounded to 4 decimal places). Risk for A Risk for B Systematic Firm-specificarrow_forwardSuppose that the index model for stocks A and B is estimated from excess returns with the following results: RA = 0.03 + 0.7 RM + eA RB = -0.02+ 1.2 RM + eB σM =0.20; R-square A = 0.25 R-square B = 0.20 What is the standard deviation of A & B, respectively? Group of answer choices 0.54, 0.28 0.28, 0.54 0.45, 0.50 0.50, 0.45arrow_forwardThe slope of a regression line when the return on an individual stock's returns are regressed on the return on the market portfolio, would be: OAR BR-₁ B OC none of the answers listed here. ODO imarrow_forward
- Suppose that the index model for stocks A and B is estimated from excess returns with the following results: RA = 3.8% + 1.25RM + eA RB = –1.8% + 1.60RM + eB σM = 18%; R-squareA = 0.24; R-squareB = 0.18 What are the covariance and correlation coefficient between the two stocks? (Do not round intermediate calculations. Calculate using numbers in decimal form, not percentages. Round your answers to 4 decimal places.)arrow_forwardA stock's beta coefficient can be calculated using the following equation: B₁ = Oi, m σε m a. Write a user-defined function that can calculate the beta coefficient. The argu- ments to the function should be the covariance between the stock and market returns, and the variance of the market's returns. For example, BETA (COVAR AS SINGLE, MARKET VAR AS SINGLE). b. Rewrite your function so that it accepts ranges of returns and then calcu- lates the beta directly from the returns. It should be defined as: BETA(STOCK- RETURNS AS RANGE, MARKETRETURNS AS RANGE). Your function should make use of Application. WorksheetFunction to calculate the covariance and variance (use Excel's COVAR.S and VAR.S functions). In the code, be sure to check to see if the number of stock returns is equal to the number of market returns. The function should return an error if the count of returns is not equal.arrow_forwardConsider the two (excess return) index model regression results for A and B. RA= 0.9% + 1.1RM , R-square = 0.590, and Residual Standard Deviation = 11% RB= -1.4% + 0.6RM, R-square = 0.456, and Residual Standard Deviation = 9.2% Which stock has more firm-specific risk, market risk, and greater fraction of return variability for market movement? Also, if rf were constant at 4.4% and the regression had been run using total rather than excess returns, what would have been the regression intercept for stock A (write as percentage, rounded to 2 decimal places)?arrow_forward
arrow_back_ios
SEE MORE QUESTIONS
arrow_forward_ios
Recommended textbooks for you
- Essentials Of InvestmentsFinanceISBN:9781260013924Author:Bodie, Zvi, Kane, Alex, MARCUS, Alan J.Publisher:Mcgraw-hill Education,


 Foundations Of FinanceFinanceISBN:9780134897264Author:KEOWN, Arthur J., Martin, John D., PETTY, J. WilliamPublisher:Pearson,
 Fundamentals of Financial Management (MindTap Cou...FinanceISBN:9781337395250Author:Eugene F. Brigham, Joel F. HoustonPublisher:Cengage Learning
 Corporate Finance (The Mcgraw-hill/Irwin Series i...FinanceISBN:9780077861759Author:Stephen A. Ross Franco Modigliani Professor of Financial Economics Professor, Randolph W Westerfield Robert R. Dockson Deans Chair in Bus. Admin., Jeffrey Jaffe, Bradford D Jordan ProfessorPublisher:McGraw-Hill Education
Essentials Of Investments
Finance
ISBN:9781260013924
Author:Bodie, Zvi, Kane, Alex, MARCUS, Alan J.
Publisher:Mcgraw-hill Education,
Foundations Of Finance
Finance
ISBN:9780134897264
Author:KEOWN, Arthur J., Martin, John D., PETTY, J. William
Publisher:Pearson,
Fundamentals of Financial Management (MindTap Cou...
Finance
ISBN:9781337395250
Author:Eugene F. Brigham, Joel F. Houston
Publisher:Cengage Learning
Corporate Finance (The Mcgraw-hill/Irwin Series i...
Finance
ISBN:9780077861759
Author:Stephen A. Ross Franco Modigliani Professor of Financial Economics Professor, Randolph W Westerfield Robert R. Dockson Deans Chair in Bus. Admin., Jeffrey Jaffe, Bradford D Jordan Professor
Publisher:McGraw-Hill Education