Cornerstones of Financial Accounting
4th Edition
ISBN: 9781337690881
Author: Jay Rich, Jeff Jones
Publisher: Cengage Learning
expand_more
expand_more
format_list_bulleted
Question

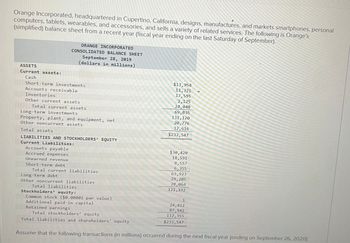
Transcribed Image Text:Orange Incorporated, headquartered in Cupertino, California, designs, manufactures, and markets smartphones, personal
computers, tablets, wearables, and accessories, and sells a variety of related services. The following is Orange's
(simplified) balance sheet from a recent year (fiscal year ending on the last Saturday of September).
ORANGE INCORPORATED
CONSOLIDATED BALANCE SHEET
September 28, 2019
(dollars in millions)
ASSETS
Current assets:
Cash
Short-term investments
Accounts receivable
Inventories
$13,954
11,321
17,595
Other current assets
2,125
24,040
Total current assets
69,035
Long-term investments
131,120
Property, plant, and equipment, net
20,776
Other noncurrent assets
12,616
Total assets
$233,547
LIABILITIES AND STOCKHOLDERS' EQUITY
Current Liabilities:
Accounts payable
$30,420
Accrued expenses
18,591
Unearned revenue
Short-term debt
8,557
6,355
Total current liabilities
63,923
Long-term debt
Other noncurrent liabilities
Total liabilities
Stockholders' equity:
Common stock ($0.00001 par value)
Additional paid-in capital
Retained earnings
Total stockholders' equity
Total liabilities and shareholders' equity
Assume that the following transactions (in millions) occurred during the next fiscal year (ending on September 26, 2020):
29,205
28,064
121,192
1
24,412
87,942
112,355
$233,547

Transcribed Image Text:Journal entry worksheet
<
1
2
3
4
5
6
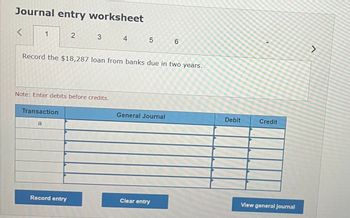
Record the $18,287 loan from banks due in two years.
Note: Enter debits before credits.
Transaction
a
General Journal
Debit
Credit
View general journal
Record entry
Clear entry
く
Expert Solution
This question has been solved!
Explore an expertly crafted, step-by-step solution for a thorough understanding of key concepts.
Step by stepSolved in 2 steps

Knowledge Booster
Similar questions
- Orange Incorporated, headquartered in Cupertino, California, designs, manufactures, and markets smartphones, personal computers, tablets, wearables, and accessories, and sells a variety of related services. The following is Orange's (simplified) balance sheet from a recent year (fiscal year ending on the last Saturday of September). ASSETS Current assets: Cash ORANGE INCORPORATED CONSOLIDATED BALANCE SHEET September 28, 2019 (dollars in millions). Short-term investments Accounts receivable Inventories Other current assets Total current assets Long-term investments. Property, plant, and equipment, net Other noncurrent assets Total assets LIABILITIES AND STOCKHOLDERS' EQUITY Current Liabilities: Accounts payable Accrued expenses Unearned revenue. Short-term debt Total current liabilities Long-term debt Other noncurrent liabilities Total liabilities Stockholders' equity: Common stock ($0.00001 par value) Additional paid-in capital Retained earnings Total stockholders' equity Total…arrow_forwardUse the following financial statements for Lake of Egypt Marina, Incorporated LAKE OF EGYPT MARINA, INCORPORATED Balance Sheet as of December 31, 2024 and 2023 (in millions of dollars) 2024 2023 Assets Liabilities and Equity Current assets: Current liabilities: Cash and marketable securities Accounts receivable Inventory $ 82 45 180 $ 48 Accrued wages and taxes 52 Accounts payable 92 Notes payable Total Fixed assets: $ 307 $ 192 Total Long-term debt: Gross plant and equipment $ 265 Less: Depreciation 70 40 Net plant and equipment Other long-term assets Total $ 195 25 $ 184 24 $ 220 $ 208 Total Total assets $ 527 $ 224 Stockholders' equity: Preferred stock (2 million shares) Common stock and paid-in surplus (24 million shares) Retained earnings $ 400 Total liabilities and equity Net sales (all credit) Less: Cost of goods sold Gross profits LAKE OF EGYPT MARINA, INCORPORATED Income Statement for Years Ending December 31, 2024 and 2023 (in millions of dollars) 2024 $ 600 216 $ 384 30 354…arrow_forwardRatio Analysis Rising Stars Academy provided the following information on its 2019 balance sheet and state mcnt of cash flows: Long-term debt S 4,400 Interest expense S 398 Total liabilities 8,972 Net income 559 Total assets 38,775 Interest payments 432 Total equity 29,803 Cash flows from operations 1.015 Operating income 1.223 Income tax expenses 266 Income taxes paid 150 Required: Calculate the following ratios for Rising Stars: (a) debt to equity, (b) debt to total assets, (c) long-term debt to equity, (d) times interest earned (accrual basis), and (e) times interest earned (cash basis). (Note: Round answers to three decimal places.) CONCEPTUAL CONNECTION Interpret these results. 3.What does it mean if a bond is callablearrow_forward
- The condensed financial statements of Carla Vista Co. for the years 2021 and 2022 are presented below. CARLA VISTA CO.Balance SheetsDecember 31 (in thousands)20222021Current assets Cash and cash equivalents$330$360 Accounts receivable (net)590520 Inventory640570 Prepaid expenses130160 Total current assets1,6901,610Property, plant, and equipment (net)410380Investments130130Intangibles and other assets530510 Total assets$2,760$2,630Current liabilities$940$910Long-term liabilities660560Stockholders’ equity—common1,1601,160 Total liabilities and stockholders’ equity$2,760$2,630 CARLA VISTA CO.Income StatementsFor the Year Ended December 31 (in thousands)20222021Sales revenue$3,980$3,640Costs and expenses Cost of goods sold1,0901,010 Selling & administrative expenses2,4002,330 Interest expense1020 Total costs and expenses3,5003,360Income before income taxes480280Income tax expense192112Net income$ 288$ 168 Compute the following ratios for 2022 and 2021.…arrow_forwardThe following information (in $ millions) comes from the Annual Report of Saratoga Springs Company for the year ending 12/31/2024: Year ended 12/31/2024 $ 8,139 4,957 2,099 Net sales Cost of goods sold Selling and administrative expense Interest expense Income before taxes Net income Cash and cash equivalents Receivables, net Inventories Land, buildings and equipment at cost, net Total assets Total current liabilities Long-term debt Total liabilities Total stockholders' equity 606 477 648 Profit margin on sales 12/31/2024 $ 1,165 1,200. 1,245 13,690 $ 17,300 $ 5,937 5,781 $ 11,718 $5,582 Required: Compute the profit margin on sales for 2024. Note: Round your answer to 1 decimal place, e.g., 0.1234 as 12.3%. 12/31/2023 $ 83 854 709 4,034 $ 5,680 $ 2,399 2,411 $ 4,810 $ 870arrow_forwardTech Supplies Company, Incorporated, is a leading retailer specializing in consumer electronics. A condensed income statement and balance sheet for the fiscal year ended February 1, 2020, are shown below. Tech Supplies Company, IncorporatedBalance SheetAt February 1, 2020($ in millions)Assets Current assets: Cash and cash equivalents $ 2,126Accounts receivable (net) 1,237Inventory 5,066Other current assets 422Total current assets 8,851Long-term assets 3,708Total assets $ 12,559Liabilities and Shareholders’ Equity Current liabilities: Accounts payable $ 5,200Other current liabilities 3,975Total current liabilities 9,175Long-term liabilities 2,246Shareholders’ equity 1,138Total liabilities and shareholders’ equity $ 12,559Tech Supplies Company, IncorporatedIncome StatementFor the Year Ended February 1, 2020($ in millions)Revenues $ 39,603Costs and expenses 38,168Operating income 1,435Other income (expense)* (80)Income…arrow_forward
- Bridgeport Corporation’s balance sheet at the end of 2019 included the following items. Current assets (Cash $82,000) $236,480 Current liabilities $151,480 Land 32,960 Bonds payable 101,480 Buildings 121,480 Common stock 182,960 Equipment 92,960 Retained earnings 46,960 Accum. depr.-buildings (31,480 ) Total $482,880 Accum. depr.-equipment (11,000 ) Patents 41,480 Total $482,880 The following information is available for 2020. 1. Net income was $54,810. 2. Equipment (cost $21,480 and accumulated depreciation $9,480) was sold for $11,480. 3. Depreciation expense was $5,480 on the building and $10,480 on equipment. 4. Patent amortization was $2,500. 5. Current assets other than cash increased by $29,000. Current liabilities increased by $14,480. 6. An addition to the building was completed at a cost of $28,480. 7. A long-term investment in stock was…arrow_forwardBridgeport Corporation’s balance sheet at the end of 2019 included the following items. Current assets (Cash $ 82,000) $ 236,480 Current liabilities $ 151,480 Land 32,960 Bonds payable 101,480 Buildings 121,480 Common stock 182,960 Equipment 92,960 Retained earnings 46,960 Accum. depr.-buildings ( 31,480 ) Total $ 482,880 Accum. depr.-equipment ( 11,000 ) Patents 41,480 Total $ 482,880 The following information is available for 2020. 1. Net income was $ 54,810. 2. Equipment (cost $ 21,480 and accumulated depreciation $ 9,480) was sold for $ 11,480. 3. Depreciation expense was $ 5,480 on the building and $ 10,480 on equipment. 4. Patent amortization was $ 2,500. 5. Current assets other than cash increased by $ 29,000. Current liabilities increased by $ 14,480. 6. An addition to the building was completed at a cost of $ 28,480. 7. A long-term investment in…arrow_forwardPresented below is the balance sheet of Pina Corporation for the current year, 2020. PINA CORPORATIONBALANCE SHEETDECEMBER 31, 2020 Current assets $ 486,360 Current liabilities $ 381,360 Investments 641,360 Long-term liabilities 1,001,360 Property, plant, and equipment 1,721,360 Stockholders’ equity 1,771,360 Intangible assets 305,000 $3,154,080 $3,154,080 The following information is presented. 1. The current assets section includes cash $151,360, accounts receivable $171,360 less $11,360 for allowance for doubtful accounts, inventories $181,360, and unearned rent revenue $6,360. Inventory is stated on the lower-of-FIFO-cost-or-net realizable value. 2. The investments section includes the cash surrender value of a life insurance contract $41,360; investments in common stock, short-term $81,360 and long-term $271,360; and bond sinking fund $247,280. The cost and fair value of investments in common stock are the same.…arrow_forward
- The Davidson Corporation's balance sheet and income statement are provided here. Davidson Corporation: Balance Sheet as of December 31, 2021 (millions of dollars) Assets Liabilities and Equity Cash and equivalents $ 20 Accounts payable $ 140 Accounts receivable 475 Accruals 310 Inventories 890 Notes payable 225 Total current assets $ 1,385 Total current liabilities $ 675 Net plant and equipment 2,560 Long-term bonds 1,500 Total liabilities $ 2,175 Common stock (100 million shares) 270 Retained earnings $ 1,500 Common equity $ 1,770 Total assets $ 3,945 Total liabilities and equity $ 3,945 Davidson Corporation: Income Statement for Year Ending December 31, 2021 (millions of dollars) Sales $ 8,500 Operating costs excluding depreciation and amortization 5,650 EBITDA $ 2,850 Depreciation and amortization 500 EBIT $ 2,350 Interest 230 EBT $ 2,120…arrow_forwardThe balance sheets for Sports Unlimited for 2021 and 2020 are provided below.SPORTS UNLIMITED Balance Sheets For the years ended December 31 2021 2020AssetsCurrent assets:Cash $ 103,500 $ 70,400Accounts receivable 46,800 32,000Inventory 44,550 71,200Prepaid rent 7,200 3,600Long-term assets:Investment in bonds 54,900 0Land 117,450 141,600Equipment 106,200 102,000Less: Accumulated depreciation (30,600) (20,800)Total…arrow_forwardSelected financial statement information for 2018, 2019, and 2023 for End Run Corporation is presented below (amounts in millions of dollars): Accounts receivable Current assets Property, plant, and equipment (net) Total assets Current liabilities Long-term debt Sales Cost of goods sold Selling and administrative expenses Income from continuing operations Cash flow from operations Depreciation expense 2020 A. 2020 SAI B. 2020 LVGI C. 2020 TATA D. 2020 Y E. 2020 earnings manipulation probability 10508 30945 11284 68787 29417 8776 101573 92207 3931 946 4837 518 2019 3905 7438 10744 31289 6595 7223 47860 32090 3315 1063 1127 550 2018 2985 5743 10493 26213 6048 7223 33906 27772 2582 739 1863 550 For 2019 and 2020, compute the following amounts relative to Beneish's eight-factor earnings manipulation model:arrow_forward
arrow_back_ios
SEE MORE QUESTIONS
arrow_forward_ios
Recommended textbooks for you
 Cornerstones of Financial AccountingAccountingISBN:9781337690881Author:Jay Rich, Jeff JonesPublisher:Cengage Learning

Cornerstones of Financial Accounting
Accounting
ISBN:9781337690881
Author:Jay Rich, Jeff Jones
Publisher:Cengage Learning