Concept explainers
Interpretation : Use of graph to convert volume of snow in a snowpack to the volume of water in the snowpack is to be explained.
Concept Introduction : Scientists measure the snowpack to predict the amount of water that will be available for consumption for the rest of year. The mountains get several feet of snow every winter and this snow melts and reaches the reservoir.When snow melts its volume decreases but its mass remains the same.
Answer to Problem 2E
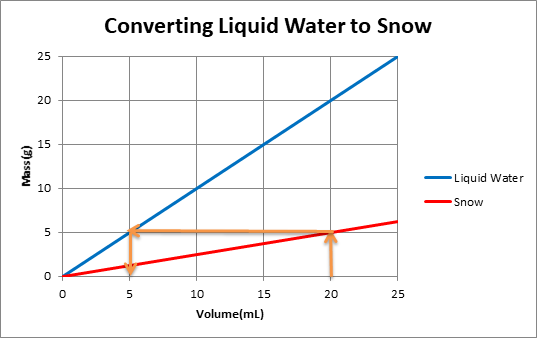
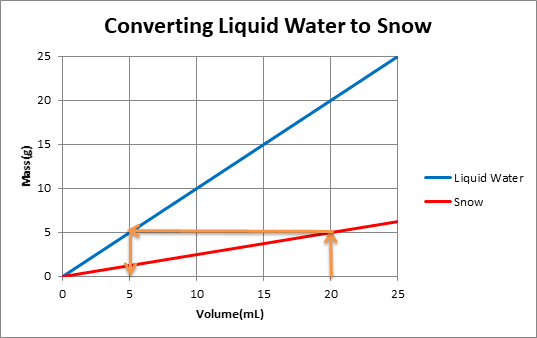
The graph below shows mass versus volume for liquid water as well as snow with a density of 0.25g/mL.

One can use the graph to convert snow volume to liquid water volume by following the orange arrows.
Explanation of Solution
When snow melts it volume decreases but its mass remains the same. This is because the same water molecules are present in frozen snow and melted snow. Density of snow is less than density of water. One can use a graph to convert from snow volume to liquid water volume.

To use the graph,one must plot 2 lines of mass versus volume, one line is for snow and another for water in liquid state. The density of the substance is determined from the slope of each line. For example:
The orange arrows on the graph show that for a volume of 20 mL of snow, mass of snow is 5g. When this snow melts, mass of water remains the same. So 5g of water is equivalent to 5mLof water.
Graphs can be used to convert volume of snow to the volume of rain water.
Chapter U3 Solutions
Living By Chemistry: First Edition Textbook
Additional Science Textbook Solutions
Microbiology: An Introduction
Chemistry (7th Edition)
Anatomy & Physiology (6th Edition)
Chemistry: An Introduction to General, Organic, and Biological Chemistry (13th Edition)
Cosmic Perspective Fundamentals
Human Biology: Concepts and Current Issues (8th Edition)
- The number of microstates corresponding to each macrostate is given by N. The dominant macrostate or configuration of a system is the macrostate with the greatest weight W. Are both statements correct?arrow_forwardFor the single step reaction: A + B → 2C + 25 kJ If the activation energy for this reaction is 35.8 kJ, sketch an energy vs. reaction coordinate diagram for this reaction. Be sure to label the following on your diagram: each of the axes, reactant compounds and product compounds, enthalpy of reaction, activation energy of the forward reaction with the correct value, activation energy of the backwards reaction with the correct value and the transition state. In the same sketch you drew, after the addition of a homogeneous catalyst, show how it would change the graph. Label any new line "catalyst" and label any new activation energy.arrow_forwardHow many grams of C are combined with 3.75 ✕ 1023 atoms of H in the compound C5H12?arrow_forward
 ChemistryChemistryISBN:9781305957404Author:Steven S. Zumdahl, Susan A. Zumdahl, Donald J. DeCostePublisher:Cengage Learning
 ChemistryChemistryISBN:9781259911156Author:Raymond Chang Dr., Jason Overby ProfessorPublisher:McGraw-Hill Education
 Principles of Instrumental AnalysisChemistryISBN:9781305577213Author:Douglas A. Skoog, F. James Holler, Stanley R. CrouchPublisher:Cengage Learning
 Organic ChemistryChemistryISBN:9780078021558Author:Janice Gorzynski Smith Dr.Publisher:McGraw-Hill Education
 Chemistry: Principles and ReactionsChemistryISBN:9781305079373Author:William L. Masterton, Cecile N. HurleyPublisher:Cengage Learning
 Elementary Principles of Chemical Processes, Bind...ChemistryISBN:9781118431221Author:Richard M. Felder, Ronald W. Rousseau, Lisa G. BullardPublisher:WILEY


