
Explanation:
Figure 1 illustrates the impact of world price and domestic price that creates trade diversification and creation.
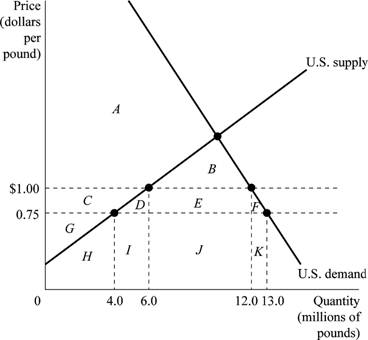
Figure 1
Figure 1 depicts the demand and supply of kumquats in the U.S. market after the quota restriction is imposed. Horizontal axis represents the quantity of kumquats in millions of pounds and the vertical axis represents the price in dollars per pound. The U.S. government imposes a quota of import of 6 million pounds of kumquats to the U.S. each year.
Using Figure 1, Table 1 is filled as follows:
Table 1
| Without Quota | With Quota | |
| World price of kumquats | $0.75 | $0.75 |
| U.S. price of kumquats | $0.75 | $1.00 |
| Quantity supplied by U.S. firms | 4 million | 6 million |
| Quantity demanded | 13 million | 12 million |
| Quantity imported | 9 million | 6 million |
| Area of consumer surplus | A + B + C + D + E + F | A + B |
| Area of domestic producer surplus | G | C + G |
| Area of deadweight loss | No deadweight loss | D + F |
When there is no quota, the quantity demanded is 13 million pounds of kumquats; out of which 4 million pounds is supplied by U.S. firms and rest 9 million pounds of kumquats
Consumer surplus is calculated as the area below the demand curve and above the market price. So, area of consumer surplus without quota is between market price of $0.75 and the demand curve, which is the sum of the areas A, B, C, D, E and F. The producer’s surplus is between U.S supply curve (above) and market price (below), which is the area G. With quota, consumer surplus is between price $1 and U.S demand curve, which is the sum of areas A and B, and the producer’s surplus which is increased by quota is the sum of areas C and G. There is no deadweight loss, if quotas are not imposed. With quota areas D and F denote the deadweight loss.
Concept introduction:
Quota: It is the numerical limit that a government imposes on the quantity of goods that can be imported into a country.
Consumer surplus: It is the monetary gain attained by a consumer, which is calculated as the difference between the price a consumer pays for the product and the price he would be willing to pay rather than do without it.
Producer surplus: It is the benefit attained by a producer by selling a product, which is calculated as the difference between the amount that a producer is willing to supply goods for and the actual amount received by him, when he makes the trade.
Measuring the economic effects of a quota.
Want to see the full answer?
Check out a sample textbook solution
Chapter 9 Solutions
Economics (7th Edition) (What's New in Economics)

- [India is the world’s largest consumer of sugar. Assume the world price for sugar is $750 per ton.] [Assume India currently has a tariff of $50 per ton on sugar and imports 7 million tons of sugar. Show this situation in a graph. Label the quantity demanded and the quantity supplied domestically and imports clearly on a graph. Explain your graph in 3-4 sentences. How to draw the graph?arrow_forwardSteel Industry Consider a small country that exports steel. Suppose the following graph depicts the domestic demand and supply for steel in this country. One of the two price lines represents the world price of steel. Use the following graph to help you answer the questions below. You will not be graded on any changes made to this graph. 1. Because this country exports steel, the world price is represented by P1 or P2. Suppose that a “pro-trade” government decides to subsidize the export of steel by paying $10 for each ton sold abroad. 2. With this export subsidy, the price paid by domestic consumers is $???? per ton, and the price received by domestic producers is $???? per ton. 3. The quantity of steel consumed by domestic consumers INCREASES or REMAINS UNCHANGED or DECREASES, the quantity of steel produced by domestic producers INCREASES or REMAINS UNCHANGED or DECREASES, and the quantity of steel exported INCREASES or REMAINS UNCHANGED or DECREASES. 4. TRUE or FALSE:…arrow_forwardOn the following graph, use the green point (triangle symbol) to shade consumer surplus in Germany after China's clothing industry expands. Then use the purple point (diamond symbol) to shade producer surplus. When China's clothing industry expands, the increase in world supply lowers the world price of clothing. Consider the effects this has on both an importer and an exporter of clothing. Suppose the following graph represents the market for clothing in Germany prior to the expansion of China's clothing industry. Germany is an(IMPORT OR EXPORT) of clothing because the world price is(ABOVE OR BELOW) the domestic equilibrium price.arrow_forward
- Georgia and Moldova are famous for their quality of wine and the United Kingdom decides to start importing from them. There is an 5£ tariff on imported wine. Considering the graph below, where does the UK buy its wine from and how much does it cost on the domestic market? Price per bottle £10 £7 Moldovan price £5 Georgian price UK demand for imported wine Quantity (millions of bottles per year) 10 15 22 Suppose the UK joins a trade bloc with Moldova and maintains its 5£ tariff on wine from outside the bloc. a) What will the new domestic price be? b) How much do consumers gain/lose? c) How about the government? d) Is there trade creation or trade dıversion or both? e) How much does the UK gain/lose?arrow_forward#3 PRICE (Dollars per tonne) cengage.com/static/nb/ui/evo/index.html?elSBN=9780357302934&snapshotld=D2741525&id3D1376796971& E CENGAGE MINDTAP Q Search thisC News Analysis: Nailing Down Metal Tariffs THIR A JA 15 ndu BILLS Consider a hypothetical example of trade in aluminum between the United States and China. For simplicity, assume that China is the only source of U.S. aluminum imports. The following graph shows the U.S. market for aluminum. Note that in the absence of any trade, the market price for aluminum in the United States is $500 per tonne, and the equilibrium quantity is 50 million tonnes per month. Use the green area (triangle symbol) to show U.S. consumer surplus under free trade with China, and use the purple area (diamond symbol) to show U.S. producer surplus under free trade with China. 0000 Domestic Demand Domestic Supply 006 Consumer Surplus 008 Producer Surplus 009 Free Trade Price 1. 06 20 08 09 QUANTITY OF ALUMINUM (Millions of tonnes per month) MacBook Air DOO F4…arrow_forwardBecause Zambia participates in international trade in the market for soybeans, it will import tons of soybeans. Now suppose the Zambian government decides to impose a tariff of $10 on each imported ton of soybeans. Under the tariff, the price Zambian consumers pay for a ton of soybeans becomes , and Zambia will import tons of soybeans. Use the following graph to show the effects of the $10 tariffarrow_forward
- Consider the New Zealand market for lemons. The following graph shows the domestic demand and domestic supply curves for lemons in New Zealand. Suppose New Zealand's government currently does not allow international trade in lemons. Use the black point (plus symbol) to indicate the equilibrium price of a ton of lemons and the equilibrium quantity of lemons in New Zealand in the absence of international trade. Then, use the green triangle (triangle symbol) to shade the area representing consumer surplus in equilibrium. Finally, use the purple triangle (diamond symbol) to shade the area representing producer surplus in equilibrium. (? 920 Domestic Demand Domestic Supply 860 Equilibrium without Trade 800 740 680 Consumer Surplus 820 580 Producer Surplus 500 440 380 320 45 90 135 180 225 270 315 380 405 450 QUANTITY (Tons of lemons) Based on the previous graph, total surplus in the absence of international trade is S The following graph shows the same domestic demand and supply curves for…arrow_forwardALL QUESTIONS APPLY TO GRAPH 28. Suppose IP is the international trade price and this country's government imposes a $3 tariff on imports of this good, what will be the net loss to this economy? 29. Suppose IP is the international trade price and this country's government imposes a $3 tariff on imports of this good, how much revenue will the government collect? 30. Suppose IP is the international trade price and this country's government imposes a 6 unit quota on imports of this good, what will be the net loss to this economY?arrow_forwardThe following graph shows the domestic supply of and demand for maize in Guatemala. The world price (Pr) of maize is $255 per ton and is represented by the horizontal black line. Throughout the question, assume that the amount demanded by any one country does not affect the world price of maize and that there are no transportation or transaction costs associated with international trade in maize. Also, assume that domestic suppliers will satisfy domestic demand as much as possible before any exporting or importing takes place. 435 Domestic Demand Domestic Supply 415 305 375 355 X 335 315 295 275 Pu W 255 235 0 40 80 300 400 120 100 200 240 280 320 QUANTITY (Tons of maize) If Guatemala is open to international trade in maize without any restrictions, it will import. tons of maize. per ton will Suppose the Guatemalan government wants to reduce imports to exactly 80 tons of maize to help domestic producers. A tariff of S achieve this. A tariff set at this level would raise $ in revenue…arrow_forward
- Suppose Zambia is open to free trade in the world market for soybeans. Since Zambia is small relative to the international market, the demand for and supply of soybeans in Zambia have no impact on the world price. The following graph shows the domestic market for soybeans in Zambia. The world price of a ton of soybeans is PW = $250. Use the following graph to show the effects of the $ 10 tariff. Use the black line (plus symbol) to indicate the world price plus the tariff. Then, use the green points (triangle symbols) to show the consumer surplus with the tariff and the purple triangle (diamond symbols) to show the producer surplus with the tariff. Lastly, use the orange quadrilateral (square symbols) to shade the area representing government revenue received from the tariff and the tan points (rectangle symbols) to shade the areas representing deadweight loss (DWL) caused by the tariff.arrow_forward8. Problems and Applications Q8 Suppose the nation of Isoland is an importer of textiles and is looking for a way to raise government revenue. The following graph shows the effect of a tariff on textile imports. Supply Demand 3. 3. Quantty of Tedies Price of Textilesarrow_forwardNow suppose the Zambian government decides to impose a tariff of $60 on each imported ton of soybeans. Under the tariff, the price Zambian consumers pay for a ton of soybeans becomes S tons of soybeans. and Zambia will import Use the following graph to show the effects of the $60 tariff. Use the black line (plus symbol) to indicate the world price plus the tariff. Then, use the green points (triangle symbols) to show the consumer surplus with the tariff and the purple triangle (diamond symbols) to show the producer surplus with the tariff. Lastly, use the orange quadrilateral (square symbols) to shade the area representing government revenue received from the tariff and the tan points (rectangle symbols) to shade the areas representing deadweight loss (DWL) caused by the tariff. PRICE (Dollars perton) 490 460 430 400 370 340 310 280 250 220 190 0 Domestic Demand Domestic Supply 20 40 60 80 100 120 140 QUANTITY (Tons of soybeans) P W 160 180 200 World Price Plus Tariff CS PS Government…arrow_forward
 Principles of Macroeconomics (MindTap Course List)EconomicsISBN:9781285165912Author:N. Gregory MankiwPublisher:Cengage Learning
 Principles of Economics, 7th Edition (MindTap Cou...EconomicsISBN:9781285165875Author:N. Gregory MankiwPublisher:Cengage Learning
 Microeconomics: Private and Public Choice (MindTa...EconomicsISBN:9781305506893Author:James D. Gwartney, Richard L. Stroup, Russell S. Sobel, David A. MacphersonPublisher:Cengage Learning
 Economics: Private and Public Choice (MindTap Cou...EconomicsISBN:9781305506725Author:James D. Gwartney, Richard L. Stroup, Russell S. Sobel, David A. MacphersonPublisher:Cengage Learning
 Macroeconomics: Private and Public Choice (MindTa...EconomicsISBN:9781305506756Author:James D. Gwartney, Richard L. Stroup, Russell S. Sobel, David A. MacphersonPublisher:Cengage Learning