
Concept explainers
Videos
To review:
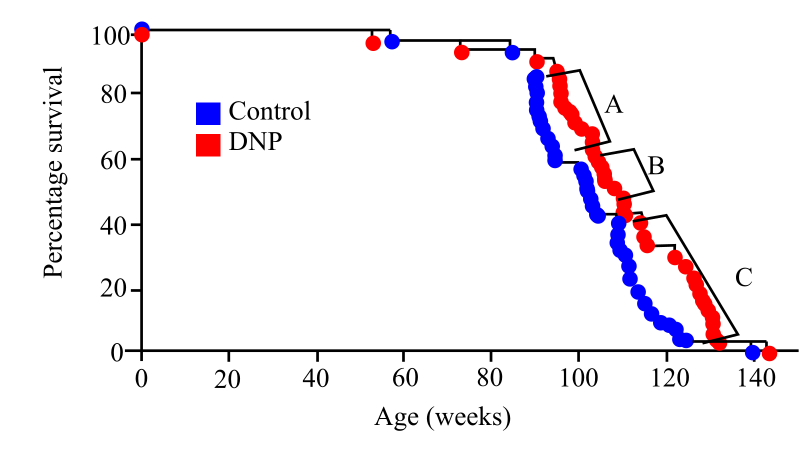
From the given graph and study, the investigators determined that a low concentration of DNP increased the average life span from 719 days (Control) to 770 days (DNP). If the U.S. population has an average life span of 79 years, then how many years would be added if the same percentage increase were observed.
Introduction:
The 2,4-dinitrophenol (DNP) is used for the mice for reducing the production of reactive oxygen species (ROS), which allows the free passage of the protons across the inner mitochondrial membrane. The rate of survival is increased in the DNP treated mice as the oxidative damage caused by the ROS is decreased by the drug. The effect of a drug called DNP on the life span of mice is shown in the graph below. Each point represents the death of a single mouse.
Want to see the full answer?
Check out a sample textbook solution
Chapter 9 Solutions
BIOLOGICAL SCIENCE


- 1) What does these results mean as shown in the three graphs and t-tests? 2) Can you explain why these three graphs and t-tests ended up with these results? 2) How could someone improve on this study using the graphs and t-tests? If other scientists did this study is there something to recommend to them? 3) What variables were not considered in the graphs and t-tests that should be?arrow_forwardImagine that the blue color of dragonflies is known to be determined by multiple genes. A group of citizen scientists observed 9 clearly different shades of blue among dragonflies. How many genes do you predict are likely involved in the determination of color in dragonflies? 4 genes 2 genes 5 genes 1 gene 3 genes 0 0 0 0 0arrow_forwardWith a doubling time of 180 minutes and a starting population size of 10 cells, how many cells will be present after 72 hours, assuming no cell death?arrow_forward
- The height of a certain population of corn plants follow a normal distribution with mean 145 cm and standard deviation 22 cm. a) What percentage of the plants are between 135 and 155 cm tall?b) Suppose we were to choose at random from the population a large number of samples of 16 plants each. In what percentage of the samples would he sample mean height between 135 and 155 cm?c) If Ŷ represents the mean height of a random sample of 36 plants from the population, what is P{ 135<=Ŷ <=155}?arrow_forwardIn a research topic related to COVID-19 and Handwashing, who would be the target population and why?arrow_forwardWith reference to this data what is the number of samples (n)?arrow_forward
- If there are 300 people with phenylketonuria in a population of 3,000,000, what is the frequency of carriers in the population? Assume that the population is in a hardy Windburg equilibrium with regards to the street. Show your calculations. arrow_forwardPhenylketonuria is a recessive autosomal genetic disorder that can cause mental retardation. Phenylketonuria is particularly common in Turkey, where 1 in 2600 children are born with the disease. As of 2011, the population of Turkey was 73.6 million. Based on this data, and assuming that the Turkish population is in Hardy-Weinberg equilibrium. (a) Estimate the number of carriers of phenylketonuria in Turkey (b) Estimate the proportion of unaffected individuals who are carriers.arrow_forwardA pilot small scale association study involving 20 subjects and two candidate SNP‘s has the results shown in the table below which SNP (s) are/is likely associated with the disease understudy?arrow_forward
- The electrophoresis gel shown below had a 4th lane (cut off and not shown) which contained 7 proteins of known molecular weight. A plot of these proteins was made with log MW on the y-axis and migration distance (cm) on the x-axis.The equation for the linear regression line is: Y = -0.1 X + 4.79If the distance between the well and the 3rd band of the Red sample is 4 cm, what is the approximate MW, expressed in daltons, of the protein at that location?arrow_forwardUsing the rule of 300, what is the approximate rate?arrow_forwardA) Identify the INDEPENDENT variable in the experimental setup shown in the diagram. B) Describe at least two possible DEPENDENT variables that could be used to evaluate the results. C) List at least 3 variables that should be controlled in this experiment.arrow_forward
