
Operations Management: Processes and Supply Chains (12th Edition) (What's New in Operations Management)
12th Edition
ISBN: 9780134741062
Author: Lee J. Krajewski, Manoj K. Malhotra, Larry P. Ritzman
Publisher: PEARSON
expand_more
expand_more
format_list_bulleted
Concept explainers
Videos
Textbook Question
Chapter 8, Problem 7P
Sales for the past 12 months at Computer Success are given here. 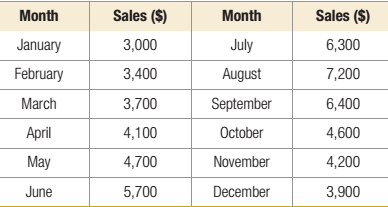
- Use a 3-month moving average to
forecast the sales for the months May through December. - Use a 4-month moving average to forecast the sales for the months May through December.
- Compare the performance of the two methods by using the mean absolute deviation as the performance criterion. Which method would you recommend?
- Compare the performance of the two methods by using the mean absolute percent error as the performance criterion. Which method would you recommend?
- Compare the performance of the two method by using the mean squared error as the performance criterion. Which method would you recommend?
Expert Solution & Answer
Want to see the full answer?
Check out a sample textbook solution
Students have asked these similar questions
The table below shows the sales figures for a brand of shoe over the last 12 months.
Months
Sales
January
69
February
75
March
86
April
92
May
95
June
100
July
108
August
115
September
125
October
131
November
140
December
150
Using the following, forecast the sales for the months up to January the following year:-
1. A simple three-month moving average.
2. A three-period weighted moving average using weights of 1, 2, and 3. Assign the highest weight to the most recent data.
3. Exponential Smoothing when α= .6 and the forecast for March is 350.
4. Determine which of the three forecasting techniques is the most accurate using MAD.
The classified department of a monthly magazine has used a combination of quantitative and qualitative methods to forecast sales of advertising space. Results over a 20-month period are as follows:Month Error1 −8 2 −2 3 4 4 7 5 9 6 5 7 0 8 −3 9 −9 10 −4 11 1
12 6 13 8 14 4 15 1 16 −2 17 −4 18 −8 19 −5 20 −1 a. Compute a tracking signal for months 11 through 20. Compute an initial value of MAD for month 11, and then update it for each month using exponential smoothing with α = .1. What can you conclude? Assume limits of ± 4.b. Using the first half of the data, construct a control chart with 2s limits. What can you conclude?c. Plot the last 10 errors on the control chart. Are the errors random? What is the implication of this?
Interpret the coefficients of your regression model. Specifically, what does the fixed component of the model mean to the consulting firm?
Interpret the fixed term,
b 0b0,
if appropriate. Choose the correct answer below.
A.
It is not appropriate to interpret
b 0b0,
because its value is the predicted billable hours for overhead costs of 0 dollars, but the firm cannot have overhead costs of 0 dollars associated with a client.
B.
The value of
b 0b0
is the predicted overhead costs for 0 billable hours.
C.
It is not appropriate to interpret
b 0b0,
because its value is the predicted overhead costs for 0 billable hours, but someone with 0 billable hours would not actually be a client of the firm.
D.
For each increase of 1 unit in billable hours, the predicted overhead costs are estimated to increase by
b 0b0.
E.
The value of
b 0b0
is the predicted billable hours for an overhead cost of 0 dollars.
F.
For each increase of 1 unit in…
Chapter 8 Solutions
Operations Management: Processes and Supply Chains (12th Edition) (What's New in Operations Management)
Ch. 8 - Figure 8.9 shows summer air visibility...Ch. 8 - Kay and Michael Passe publish What‘s...Ch. 8 - Demand for oil changes at Garcia’s Garage has...Ch. 8 - Prob. 2PCh. 8 - Ohio Swiss Milk Products manufactures and...Ch. 8 - A manufacturing firm has developed a skills test,...Ch. 8 - The materials handling manager of a manufacturing...Ch. 8 - Marianne Kramer, the owner of Handy Man Rentals,...Ch. 8 - Sales for the past 12 months at Computer Success...Ch. 8 - Bradley’s Copiers sells and repairs photocopy...
Ch. 8 - Consider the sales data for Computer Success given...Ch. 8 - A convenience store recently started to carry a...Ch. 8 - Community Federal Bank in Dothan, Alabama,...Ch. 8 - The number of heart surgeries performed at...Ch. 8 - The following data are for calculator sales in...Ch. 8 - Prob. 14PCh. 8 - Forrest and Dan make boxes of chocolates for which...Ch. 8 - The manager of Alaina’s Garden Center must make...Ch. 8 - The manager of a utility company in the Texas...Ch. 8 - Franklin Tooling, Inc., manufactures specialty...Ch. 8 - Create an Excel spreadsheet on your own that can...Ch. 8 - Prob. 20PCh. 8 - Using the data in Problem 20 and the Time-Series...Ch. 8 - Prob. 22PCh. 8 - Cannister, Inc., specializes in the manufacture of...Ch. 8 - The Midwest Computer Company serves a large number...Ch. 8 - A certain food item at P=0.20 (with a combination...Ch. 8 - Prob. 26PCh. 8 - Prob. 27PCh. 8 - A manufacturing firm seeks to develop a better...Ch. 8 - How much does the forecasting process at Deckers...Ch. 8 - Prob. 2VCCh. 8 - What factors make forecasting at Deckers...Ch. 8 - Prob. 4VCCh. 8 - Prob. 5VCCh. 8 - Comment on the forecasting system being used by...Ch. 8 - Develop your own forecast for bow rakes for each...
Additional Business Textbook Solutions
Find more solutions based on key concepts
Feeding America Each year, the Feeding America network helps provide food to more than 46 million people facing...
Operations and Supply Chain Management 9th edition
There is a huge demand in the United States and elsewhere for affordable women’s clothing. Low-cost clothing re...
Operations Management
There is a huge demand in the United States and elsewhere for affordable women’s clothing. Low-cost clothing re...
Loose-leaf for Operations Management (The Mcgraw-hill Series in Operations and Decision Sciences)
2. Identify four people who have contributed to the theory and techniques of operations management.
Operations Management: Sustainability and Supply Chain Management (12th Edition)
Many companies including Company OM tried to implement dynamic pricing in their ticketing system. The dynamic p...
Principles of Operations Management: Sustainability and Supply Chain Management (10th Edition)
Knowledge Booster


Learn more about
Need a deep-dive on the concept behind this application? Look no further. Learn more about this topic, operations-management and related others by exploring similar questions and additional content below.Similar questions
- The owner of a restaurant in Bloomington, Indiana, has recorded sales data for the past 19 years. He has also recorded data on potentially relevant variables. The data are listed in the file P13_17.xlsx. a. Estimate a simple regression equation involving annual sales (the dependent variable) and the size of the population residing within 10 miles of the restaurant (the explanatory variable). Interpret R-square for this regression. b. Add another explanatory variableannual advertising expendituresto the regression equation in part a. Estimate and interpret this expanded equation. How does the R-square value for this multiple regression equation compare to that of the simple regression equation estimated in part a? Explain any difference between the two R-square values. How can you use the adjusted R-squares for a comparison of the two equations? c. Add one more explanatory variable to the multiple regression equation estimated in part b. In particular, estimate and interpret the coefficients of a multiple regression equation that includes the previous years advertising expenditure. How does the inclusion of this third explanatory variable affect the R-square, compared to the corresponding values for the equation of part b? Explain any changes in this value. What does the adjusted R-square for the new equation tell you?arrow_forwardThe Baker Company wants to develop a budget to predict how overhead costs vary with activity levels. Management is trying to decide whether direct labor hours (DLH) or units produced is the better measure of activity for the firm. Monthly data for the preceding 24 months appear in the file P13_40.xlsx. Use regression analysis to determine which measure, DLH or Units (or both), should be used for the budget. How would the regression equation be used to obtain the budget for the firms overhead costs?arrow_forwardDo the sales prices of houses in a given community vary systematically with their sizes (as measured in square feet)? Answer this question by estimating a simple regression equation where the sales price of the house is the dependent variable, and the size of the house is the explanatory variable. Use the sample data given in P13_06.xlsx. Interpret your estimated equation, the associated R-square value, and the associated standard error of estimate.arrow_forward
- The file P13_02.xlsx contains five years of monthly data on sales (number of units sold) for a particular company. The company suspects that except for random noise, its sales are growing by a constant percentage each month and will continue to do so for at least the near future. a. Explain briefly whether the plot of the series visually supports the companys suspicion. b. By what percentage are sales increasing each month? c. What is the MAPE for the forecast model in part b? In words, what does it measure? Considering its magnitude, does the model seem to be doing a good job? d. In words, how does the model make forecasts for future months? Specifically, given the forecast value for the last month in the data set, what simple arithmetic could you use to obtain forecasts for the next few months?arrow_forwardThe file P13_26.xlsx contains the monthly number of airline tickets sold by the CareFree Travel Agency. a. Create a time series chart of the data. Based on what you see, which of the exponential smoothing models do you think will provide the best forecasting model? Why? b. Use simple exponential smoothing to forecast these data, using a smoothing constant of 0.1. c. Repeat part b, but search for the smoothing constant that makes RMSE as small as possible. Does it make much of an improvement over the model in part b?arrow_forwardThe file P13_29.xlsx contains monthly time series data for total U.S. retail sales of building materials (which includes retail sales of building materials, hardware and garden supply stores, and mobile home dealers). a. Is seasonality present in these data? If so, characterize the seasonality pattern. b. Use Winters method to forecast this series with smoothing constants = = 0.1 and = 0.3. Does the forecast series seem to track the seasonal pattern well? What are your forecasts for the next 12 months?arrow_forward
- Stock market analysts are continually looking for reliable predictors of stock prices. Consider the problem of modeling the price per share of electric utility stocks (Y). Two variables thought to influence this stock price are return on average equity (X1) and annual dividend rate (X2). The stock price, returns on equity, and dividend rates on a randomly selected day for 16 electric utility stocks are provided in the file P13_15.xlsx. Estimate a multiple regression equation using the given data. Interpret each of the estimated regression coefficients. Also, interpret the standard error of estimate and the R-square value for these data.arrow_forwardThe file P13_28.xlsx contains monthly retail sales of U.S. liquor stores. a. Is seasonality present in these data? If so, characterize the seasonality pattern. b. Use Winters method to forecast this series with smoothing constants = = 0.1 and = 0.3. Does the forecast series seem to track the seasonal pattern well? What are your forecasts for the next 12 months?arrow_forwardThe management of a technology company is trying to determine the variable that best explains the variation of employee salaries using a sample of 52 full-time employees; see the file P13_08.xlsx. Estimate simple linear regression equations to identify which of the following has the strongest linear relationship with annual salary: the employees gender, age, number of years of relevant work experience prior to employment at the company, number of years of employment at the company, or number of years of post secondary education. Provide support for your conclusion.arrow_forward
- Management of a home appliance store wants to understand the growth pattern of the monthly sales of a new technology device over the past two years. The managers have recorded the relevant data in the file P13_05.xlsx. Have the sales of this device been growing linearly over the past 24 months? By examining the results of a linear trend line, explain why or why not.arrow_forwardSuppose that a regional express delivery service company wants to estimate the cost of shipping a package (Y) as a function of cargo type, where cargo type includes the following possibilities: fragile, semifragile, and durable. Costs for 15 randomly chosen packages of approximately the same weight and same distance shipped, but of different cargo types, are provided in the file P13_16.xlsx. a. Estimate a regression equation using the given sample data, and interpret the estimated regression coefficients. b. According to the estimated regression equation, which cargo type is the most costly to ship? Which cargo type is the least costly to ship? c. How well does the estimated equation fit the given sample data? How might the fit be improved? d. Given the estimated regression equation, predict the cost of shipping a package with semifragile cargo.arrow_forwardThe file P13_25.xlsx contains the quarterly numbers of applications for home mortgage loans at a branch office of Northern Central Bank. a. Create a time series chart of the data. Based on what you see, which of the exponential smoothing models do you think will provide the best forecasting model? Why? b. Use simple exponential smoothing to forecast these data, using a smoothing constant of 0.1. c. Repeat part b, but search for the smoothing constant that makes RMSE as small as possible. Does it make much of an improvement over the model in part b? Is it guaranteed to produce better forecasts for the future?arrow_forward
arrow_back_ios
SEE MORE QUESTIONS
arrow_forward_ios
Recommended textbooks for you
 Practical Management ScienceOperations ManagementISBN:9781337406659Author:WINSTON, Wayne L.Publisher:Cengage,
Practical Management Science
Operations Management
ISBN:9781337406659
Author:WINSTON, Wayne L.
Publisher:Cengage,
Single Exponential Smoothing & Weighted Moving Average Time Series Forecasting; Author: Matt Macarty;https://www.youtube.com/watch?v=IjETktmL4Kg;License: Standard YouTube License, CC-BY
Introduction to Forecasting - with Examples; Author: Dr. Bharatendra Rai;https://www.youtube.com/watch?v=98K7AG32qv8;License: Standard Youtube License