
Operations Management: Processes and Supply Chains (12th Edition) (What's New in Operations Management)
12th Edition
ISBN: 9780134741062
Author: Lee J. Krajewski, Manoj K. Malhotra, Larry P. Ritzman
Publisher: PEARSON
expand_more
expand_more
format_list_bulleted
Concept explainers
Videos
Textbook Question
Chapter 8, Problem 25P
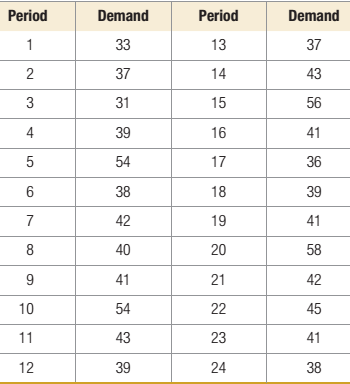
A certain food item at P&Q Supermarkets has the demand pattern shown in the following 24-period table.
- Use the combination
forecasting method of the Time-Series Forecasting Solver of OM Explorer. Let error analysis begin in month 6, and include (1) a five-period moving average (with a combination weight of 0.33), (2) an exponential smoothing model with - The need to account for seasonality is apparent if you look at a graph of the trend line. There is a spike in demand in the fifth period of each 5-period cycle. Unfortunately, OM Explorer’s Seasonal Forecasting Solver does not cover the case where there are five periods in a cycle (or seasons in a year). You must do some manual calculations. Begin by calculating the seasonal factor for each period in each of the first four cycles, and then calculating the average seasonal factor for each period (see Example 8.6). Now estimate the total demand for cycle 5 using OM Explorer’s Trend Projection routine in the Time-Series Solver. The dependent variables (see pages 298-300) are the total demands for the first four cycles. Now multiply the average demand estimate for the fifth cycle by the seasonal factor for the fifth period. This is your forecast for mouth 25. To calculate the errors (including MAD) for the multiplicative seasonal method for all cycles (except for the fifth month in the fifth cycle), calculate MAD manually. You might instead use the Error Analysis Module of POM for Windows.
- How do the forecasts by the two methods compare? Which one is likely to give the better forecast, based on MAD?
Expert Solution & Answer
Want to see the full answer?
Check out a sample textbook solution
Students have asked these similar questions
Demand for oil changes at Garcia's Garage has been as follows:
Number of Oil Changes
January
44
February
49
March
66
IT
April
59
May
53
June
58
59
63
Month
July
August
a. Use simple linear regression analysis to develop a forecasting model for monthly demand. In this application, the dependent variable, Y, is monthly demand and the independent variable, X, is the month. For Janu
The forecasting model is given by the equation Y=+x. (Enter your responses rounded to two decimal places)
J
Show Transcribed Text
>. Use the model to forecast demand for September, October, and November. Here, X=9, 10, and 11, respectively. (Enter your responses rounded to two decimal places.)
Forecast for the number of
Oil Changes
Show Transcribed Text
Month
September
October
November
can you do all the parts please corrrect
The demand (in number of units) for Apple iPad over the past 6 months at BestBuy is
summarized below.
Month
Nov 2019
Dec 2019
Demand
45
48
Jan 2020
50
Feb 2020
Mar 2020
Apr 2020
42
46
51
Consider the following three forecasting methods:
• Two-month weighted moving average, with weights 6 and 2 (more weight assigned
to more recent data)
Exponential smoothing with a = 0.7. Let the initial forecast for Nov 2019 be 46.
• A trend line projection in the form ŷ = a+bx . To simplify computations,
transform the value of x (time) to simpler numbers – designate Nov 2019 as x=1,
Dec 2019 as x= 2, etc.
(a ) For each of the above methods, forecast the demand of Apple iPad for May 2020.
(b) Consider only the two-month weighted moving average method, compute the
MAD measure and the MSE measure using the data from Jan 2020.
(c) Use the trend line to forecast the demand of Apple iPad for Dec 2020.
Give your opinion regarding the reliability of the forecast.
The following data are for calculator sales in units at anelectronics store over the past 9 weeks:
Use trend projection with regression to forecast sales for weeks10–13. What are the error measures (CFE, MSE, s, MAD, andMAPE) for this forecasting procedure? How about r2?
Chapter 8 Solutions
Operations Management: Processes and Supply Chains (12th Edition) (What's New in Operations Management)
Ch. 8 - Figure 8.9 shows summer air visibility...Ch. 8 - Kay and Michael Passe publish What‘s...Ch. 8 - Demand for oil changes at Garcia’s Garage has...Ch. 8 - Prob. 2PCh. 8 - Ohio Swiss Milk Products manufactures and...Ch. 8 - A manufacturing firm has developed a skills test,...Ch. 8 - The materials handling manager of a manufacturing...Ch. 8 - Marianne Kramer, the owner of Handy Man Rentals,...Ch. 8 - Sales for the past 12 months at Computer Success...Ch. 8 - Bradley’s Copiers sells and repairs photocopy...
Ch. 8 - Consider the sales data for Computer Success given...Ch. 8 - A convenience store recently started to carry a...Ch. 8 - Community Federal Bank in Dothan, Alabama,...Ch. 8 - The number of heart surgeries performed at...Ch. 8 - The following data are for calculator sales in...Ch. 8 - Prob. 14PCh. 8 - Forrest and Dan make boxes of chocolates for which...Ch. 8 - The manager of Alaina’s Garden Center must make...Ch. 8 - The manager of a utility company in the Texas...Ch. 8 - Franklin Tooling, Inc., manufactures specialty...Ch. 8 - Create an Excel spreadsheet on your own that can...Ch. 8 - Prob. 20PCh. 8 - Using the data in Problem 20 and the Time-Series...Ch. 8 - Prob. 22PCh. 8 - Cannister, Inc., specializes in the manufacture of...Ch. 8 - The Midwest Computer Company serves a large number...Ch. 8 - A certain food item at P=0.20 (with a combination...Ch. 8 - Prob. 26PCh. 8 - Prob. 27PCh. 8 - A manufacturing firm seeks to develop a better...Ch. 8 - How much does the forecasting process at Deckers...Ch. 8 - Prob. 2VCCh. 8 - What factors make forecasting at Deckers...Ch. 8 - Prob. 4VCCh. 8 - Prob. 5VCCh. 8 - Comment on the forecasting system being used by...Ch. 8 - Develop your own forecast for bow rakes for each...
Additional Business Textbook Solutions
Find more solutions based on key concepts
There is a huge demand in the United States and elsewhere for affordable women’s clothing. Low-cost clothing re...
Loose-leaf for Operations Management (The Mcgraw-hill Series in Operations and Decision Sciences)
The flowchart for the process at the local car wash. Introduction: Flowchart: A flowchart is a visualrepresenta...
Principles Of Operations Management
What are the three major business functions, and how are they related to one another? Give specific examples.
Operations Management, Binder Ready Version: An Integrated Approach
What is precedent, and how does it affect common law?
Business in Action (8th Edition)
2. In what circumstances might a market-pull approach or a technology-push approach to new-product design be th...
OPERATIONS MANAGEMENT IN THE SUPPLY CHAIN: DECISIONS & CASES (Mcgraw-hill Series Operations and Decision Sciences)
2. Identify four people who have contributed to the theory and techniques of operations management.
Operations Management: Sustainability and Supply Chain Management (12th Edition)
Knowledge Booster


Learn more about
Need a deep-dive on the concept behind this application? Look no further. Learn more about this topic, operations-management and related others by exploring similar questions and additional content below.Similar questions
- Under what conditions might a firm use multiple forecasting methods?arrow_forwardThe file P13_42.xlsx contains monthly data on consumer revolving credit (in millions of dollars) through credit unions. a. Use these data to forecast consumer revolving credit through credit unions for the next 12 months. Do it in two ways. First, fit an exponential trend to the series. Second, use Holts method with optimized smoothing constants. b. Which of these two methods appears to provide the best forecasts? Answer by comparing their MAPE values.arrow_forwardThe owner of a restaurant in Bloomington, Indiana, has recorded sales data for the past 19 years. He has also recorded data on potentially relevant variables. The data are listed in the file P13_17.xlsx. a. Estimate a simple regression equation involving annual sales (the dependent variable) and the size of the population residing within 10 miles of the restaurant (the explanatory variable). Interpret R-square for this regression. b. Add another explanatory variableannual advertising expendituresto the regression equation in part a. Estimate and interpret this expanded equation. How does the R-square value for this multiple regression equation compare to that of the simple regression equation estimated in part a? Explain any difference between the two R-square values. How can you use the adjusted R-squares for a comparison of the two equations? c. Add one more explanatory variable to the multiple regression equation estimated in part b. In particular, estimate and interpret the coefficients of a multiple regression equation that includes the previous years advertising expenditure. How does the inclusion of this third explanatory variable affect the R-square, compared to the corresponding values for the equation of part b? Explain any changes in this value. What does the adjusted R-square for the new equation tell you?arrow_forward
- The Baker Company wants to develop a budget to predict how overhead costs vary with activity levels. Management is trying to decide whether direct labor hours (DLH) or units produced is the better measure of activity for the firm. Monthly data for the preceding 24 months appear in the file P13_40.xlsx. Use regression analysis to determine which measure, DLH or Units (or both), should be used for the budget. How would the regression equation be used to obtain the budget for the firms overhead costs?arrow_forwardThe file P13_26.xlsx contains the monthly number of airline tickets sold by the CareFree Travel Agency. a. Create a time series chart of the data. Based on what you see, which of the exponential smoothing models do you think will provide the best forecasting model? Why? b. Use simple exponential smoothing to forecast these data, using a smoothing constant of 0.1. c. Repeat part b, but search for the smoothing constant that makes RMSE as small as possible. Does it make much of an improvement over the model in part b?arrow_forwardThe file P13_29.xlsx contains monthly time series data for total U.S. retail sales of building materials (which includes retail sales of building materials, hardware and garden supply stores, and mobile home dealers). a. Is seasonality present in these data? If so, characterize the seasonality pattern. b. Use Winters method to forecast this series with smoothing constants = = 0.1 and = 0.3. Does the forecast series seem to track the seasonal pattern well? What are your forecasts for the next 12 months?arrow_forward
- The file P13_28.xlsx contains monthly retail sales of U.S. liquor stores. a. Is seasonality present in these data? If so, characterize the seasonality pattern. b. Use Winters method to forecast this series with smoothing constants = = 0.1 and = 0.3. Does the forecast series seem to track the seasonal pattern well? What are your forecasts for the next 12 months?arrow_forwardDo the sales prices of houses in a given community vary systematically with their sizes (as measured in square feet)? Answer this question by estimating a simple regression equation where the sales price of the house is the dependent variable, and the size of the house is the explanatory variable. Use the sample data given in P13_06.xlsx. Interpret your estimated equation, the associated R-square value, and the associated standard error of estimate.arrow_forwardThe file P13_25.xlsx contains the quarterly numbers of applications for home mortgage loans at a branch office of Northern Central Bank. a. Create a time series chart of the data. Based on what you see, which of the exponential smoothing models do you think will provide the best forecasting model? Why? b. Use simple exponential smoothing to forecast these data, using a smoothing constant of 0.1. c. Repeat part b, but search for the smoothing constant that makes RMSE as small as possible. Does it make much of an improvement over the model in part b? Is it guaranteed to produce better forecasts for the future?arrow_forward
- A small computer chip manufacturer wants to forecast monthly ozperating costs as a function of the number of units produced during a month. The company has collected the 16 months of data in the file P13_34.xlsx. a. Determine an equation that can be used to predict monthly production costs from units produced. Are there any outliers? b. How could the regression line obtained in part a be used to determine whether the company was efficient or inefficient during any particular month?arrow_forwardSuppose that a regional express delivery service company wants to estimate the cost of shipping a package (Y) as a function of cargo type, where cargo type includes the following possibilities: fragile, semifragile, and durable. Costs for 15 randomly chosen packages of approximately the same weight and same distance shipped, but of different cargo types, are provided in the file P13_16.xlsx. a. Estimate a regression equation using the given sample data, and interpret the estimated regression coefficients. b. According to the estimated regression equation, which cargo type is the most costly to ship? Which cargo type is the least costly to ship? c. How well does the estimated equation fit the given sample data? How might the fit be improved? d. Given the estimated regression equation, predict the cost of shipping a package with semifragile cargo.arrow_forwardThe management of a technology company is trying to determine the variable that best explains the variation of employee salaries using a sample of 52 full-time employees; see the file P13_08.xlsx. Estimate simple linear regression equations to identify which of the following has the strongest linear relationship with annual salary: the employees gender, age, number of years of relevant work experience prior to employment at the company, number of years of employment at the company, or number of years of post secondary education. Provide support for your conclusion.arrow_forward
arrow_back_ios
SEE MORE QUESTIONS
arrow_forward_ios
Recommended textbooks for you
 Practical Management ScienceOperations ManagementISBN:9781337406659Author:WINSTON, Wayne L.Publisher:Cengage,
 Contemporary MarketingMarketingISBN:9780357033777Author:Louis E. Boone, David L. KurtzPublisher:Cengage Learning
 MarketingMarketingISBN:9780357033791Author:Pride, William MPublisher:South Western Educational Publishing
Practical Management Science
Operations Management
ISBN:9781337406659
Author:WINSTON, Wayne L.
Publisher:Cengage,
Contemporary Marketing
Marketing
ISBN:9780357033777
Author:Louis E. Boone, David L. Kurtz
Publisher:Cengage Learning
Marketing
Marketing
ISBN:9780357033791
Author:Pride, William M
Publisher:South Western Educational Publishing
Single Exponential Smoothing & Weighted Moving Average Time Series Forecasting; Author: Matt Macarty;https://www.youtube.com/watch?v=IjETktmL4Kg;License: Standard YouTube License, CC-BY
Introduction to Forecasting - with Examples; Author: Dr. Bharatendra Rai;https://www.youtube.com/watch?v=98K7AG32qv8;License: Standard Youtube License