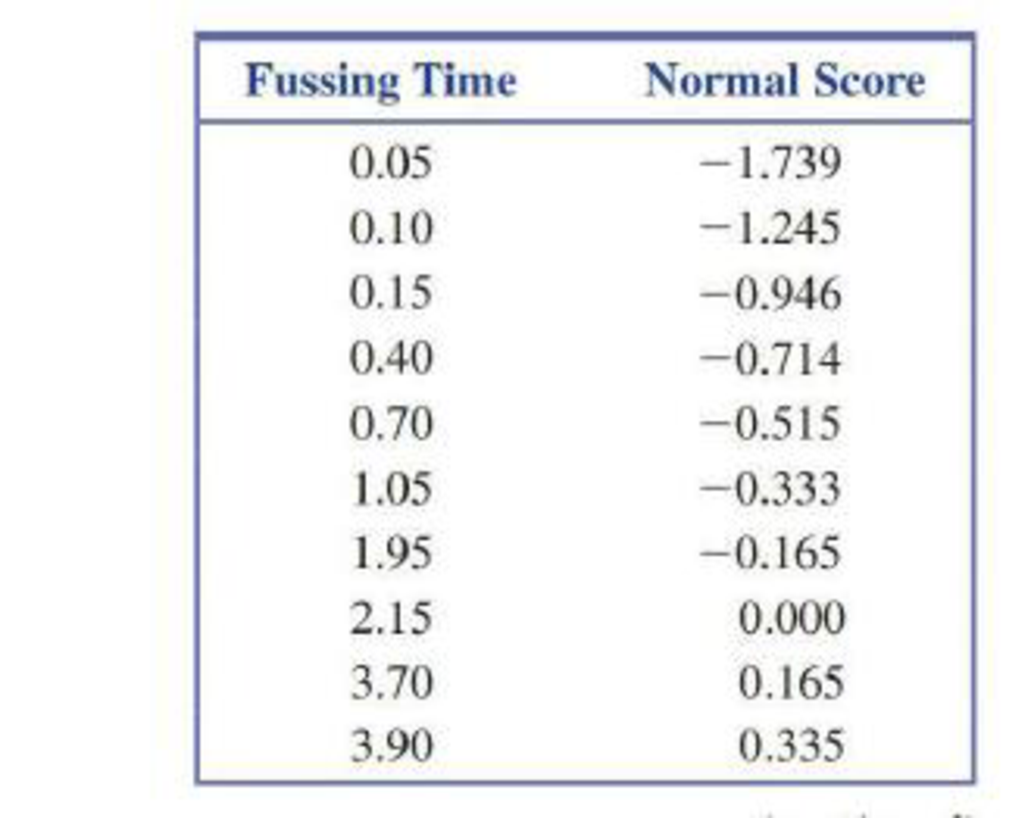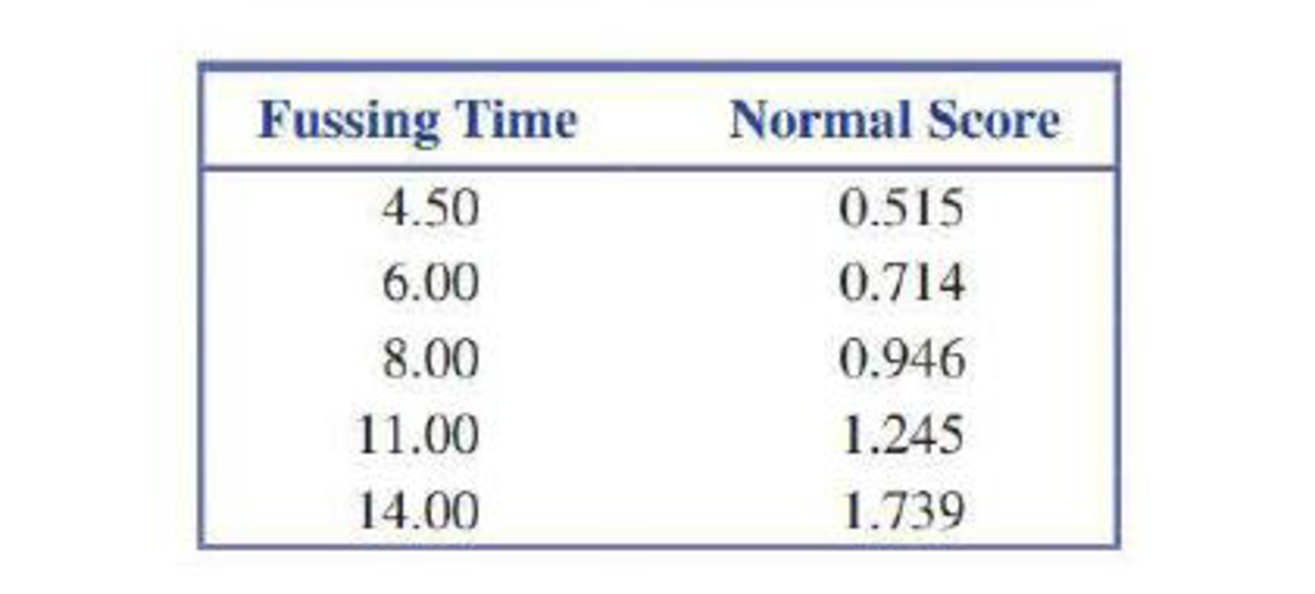
The authors of the paper “Development of Nutritionally At-Risk Young Children is Predicted by Malaria, Anemia, and Stunting in Pemba, Zanzibar” (The Journal of Nutrition [2009]:763–772) studied factors that might be related to dietary deficiencies in children. Children were observed for a length of time and the time spent in various activities was recorded. One variable of interest was the length of time (in minutes) a child spent fussing.
The authors comment that the distribution of fussing times was skewed and that they used a square root transformation to create a distribution that was more approximately normal. Data consistent with summary quantities in the paper for 15 children are given in the accompanying table.
Normal scores for a samples size of 15 are also given.


- a. Construct a normal
probability plot for the fussing time data. (Hint: See Example 7.31.) - b. Does the plot from Part (a) look linear? Do you agree with the authors of the paper that the fussing time distribution is not normal?
- c. Transform the data by taking the square root of each data value. Construct a normal probability plot for the square root transformed data.
- d. How do the normal probability plots from Parts (a) and (c) compare?
Want to see the full answer?
Check out a sample textbook solution
Chapter 7 Solutions
Introduction To Statistics And Data Analysis
- Urban Travel Times Population of cities and driving times are related, as shown in the accompanying table, which shows the 1960 population N, in thousands, for several cities, together with the average time T, in minutes, sent by residents driving to work. City Population N Driving time T Los Angeles 6489 16.8 Pittsburgh 1804 12.6 Washington 1808 14.3 Hutchinson 38 6.1 Nashville 347 10.8 Tallahassee 48 7.3 An analysis of these data, along with data from 17 other cities in the United States and Canada, led to a power model of average driving time as a function of population. a Construct a power model of driving time in minutes as a function of population measured in thousands b Is average driving time in Pittsburgh more or less than would be expected from its population? c If you wish to move to a smaller city to reduce your average driving time to work by 25, how much smaller should the city be?arrow_forwardWhat is an experiment?arrow_forwardAn important issue is whether there are racial differences in hypertension among children. We define hypertension as being above the 95th percentile for either systolic blood pressure (SBP) or diastolic blood pressure (DBP) among children of the same age, height, and sex. Since some of the children were observed at multiple visits, a GEE model was run of hypertension on ethnic group. There were three ethnic groups considered: Caucasian, African American, and Hispanic. One issue is that BMI, which may vary among ethnic groups, is positively related to hypertension. Hence, a logistic regression model was run, as shown in Table 13.55. 13.89 What is the estimated OR for hypertension comparing Hispanic boys vs. Caucasian boys based on the results in Table 13.55? (Call this OR2 .) Provide a 95% CI for this estimate. 13.90 Suppose the average BMI of Hispanic boys is higher than that for Caucasian boys. Is BMI a confounder of the association between ethnic group and hypertension? If so, is it…arrow_forward
- Is there a relationship between autism and what an infant is fed? To determine if there is, a researcher asked a random sample of mothers what they had fed their infant and they also recorded whether or not the child was autistic. Almost all brands of formula sold in the U.S. are now fortified with DHA (docosahexaenoic acid) and ARA (arachidonic acid). The data are in the table below. Do the data provide enough evidence to show that that what an infant is fed and autism are dependent? Test at the 1% level and round expected values to one decimal place. what an infant is fed yes (Observed) yes (Expected Value) no (Observed) no (Expected Value) Row Total breastmilk 6 422 428 formula with DHA/ARA 7 1156 1163 formula without DHA/ARA 15 525 540 Column Total 28 2103 2131 H: HypothesesHo:Ho:Select an answer whether or not a child has autism infant infants yes and Select an answer what an infant is fed infant infants no are Select an answer independent…arrow_forwardGrey-Seal Nursing. The average lactation (nursing) period of all earless seals is 23 days. Grey seals are one of several types of earless seals. The length of time that a female grey seal nurses her pup is studied by S. Twiss et al. in the article “Variation in Female Grey Seal (Halichoerus grypus) Reproductive Performance Corre- lates to Proactive-Reactive Behavioural Types” (PLOS ONE 7(11): e49598. doi:10.1371/journal.pone.0049598). A sample of 14 female grey seals had the following lactation periods, in days. At the 5% significance level, do the data provide sufficient evidence to conclude that the mean lactation period of grey seals differs from 23 days? Assume that the population standard deviation is 3.0 days. (Note: The sum of the data is 274.9 days.)arrow_forwardA researcher is interested in exploring the relationship between calcium intake and weight loss. Two different groups, each with 2323 dieters, are chosen for the study. Group A is required to follow a specific diet and exercise regimen, and also take a 500500-mg supplement of calcium each day. Group B is required to follow the same diet and exercise regimen, but with no supplemental calcium. After six months on the program, the members of Group A had lost a mean of 15.8 pounds with a standard deviation of 1.9 pounds. The members of Group B had lost a mean of 16.6 pounds with a standard deviation of 1.4 pounds during the same time period. Assume that the population variances are not the same. Construct a 99% confidence interval to estimate the true difference between the mean amounts of weight lost by dieters who supplement with calcium and those who do not. Let Population 1 be the amount of weight lost by Group A, who took a 500-mg supplement of calcium each day, and let Population 2…arrow_forward
- A researcher is interested in exploring the relationship between calcium intake and weight loss. Two different groups, each with 2828 dieters, are chosen for the study. Group A is required to follow a specific diet and exercise regimen, and also take a 500500-mg supplement of calcium each day. Group B is required to follow the same diet and exercise regimen, but with no supplemental calcium. After six months on the program, the members of Group A had lost a mean of 15.215.2 pounds with a standard deviation of 2.52.5 pounds. The members of Group B had lost a mean of 12.312.3 pounds with a standard deviation of 1.91.9 pounds during the same time period. Assume that the population variances are not the same. Construct a 95%95% confidence interval to estimate the true difference between the mean amounts of weight lost by dieters who supplement with calcium and those who do not. Let Population 1 be the amount of weight lost by Group A, who took a 500500-mg supplement of calcium each day,…arrow_forwardThese 2 questions go hand to handarrow_forward
 Functions and Change: A Modeling Approach to Coll...AlgebraISBN:9781337111348Author:Bruce Crauder, Benny Evans, Alan NoellPublisher:Cengage Learning
 Linear Algebra: A Modern IntroductionAlgebraISBN:9781285463247Author:David PoolePublisher:Cengage Learning
 Holt Mcdougal Larson Pre-algebra: Student Edition...AlgebraISBN:9780547587776Author:HOLT MCDOUGALPublisher:HOLT MCDOUGAL
 Glencoe Algebra 1, Student Edition, 9780079039897...AlgebraISBN:9780079039897Author:CarterPublisher:McGraw Hill
 Big Ideas Math A Bridge To Success Algebra 1: Stu...AlgebraISBN:9781680331141Author:HOUGHTON MIFFLIN HARCOURTPublisher:Houghton Mifflin Harcourt


