
Videos
Macular degeneration is the most common cause of blindness in people older than 60 years. One variable thought to be related to a type of inflammation associated with this disease is level of a substance called soluble Fas ligand (sFasL) in the blood.
The accompanying table contains representative data on x = sFasL level for 10 patients with age-related macular degeneration. These data are consistent with summary quantities and descriptions of the data given in the paper “Associations of Plasma-Soluble Fas Ligand with Aging and Age-Related Macular Degeneration” (Investigative Ophthalmology & Visual Science [2008]: 1345–1349).
The authors of the paper noted that the distribution of sFasL level was skewed and recommended a cube-root transformation. The cube-root values and the normal scores for a
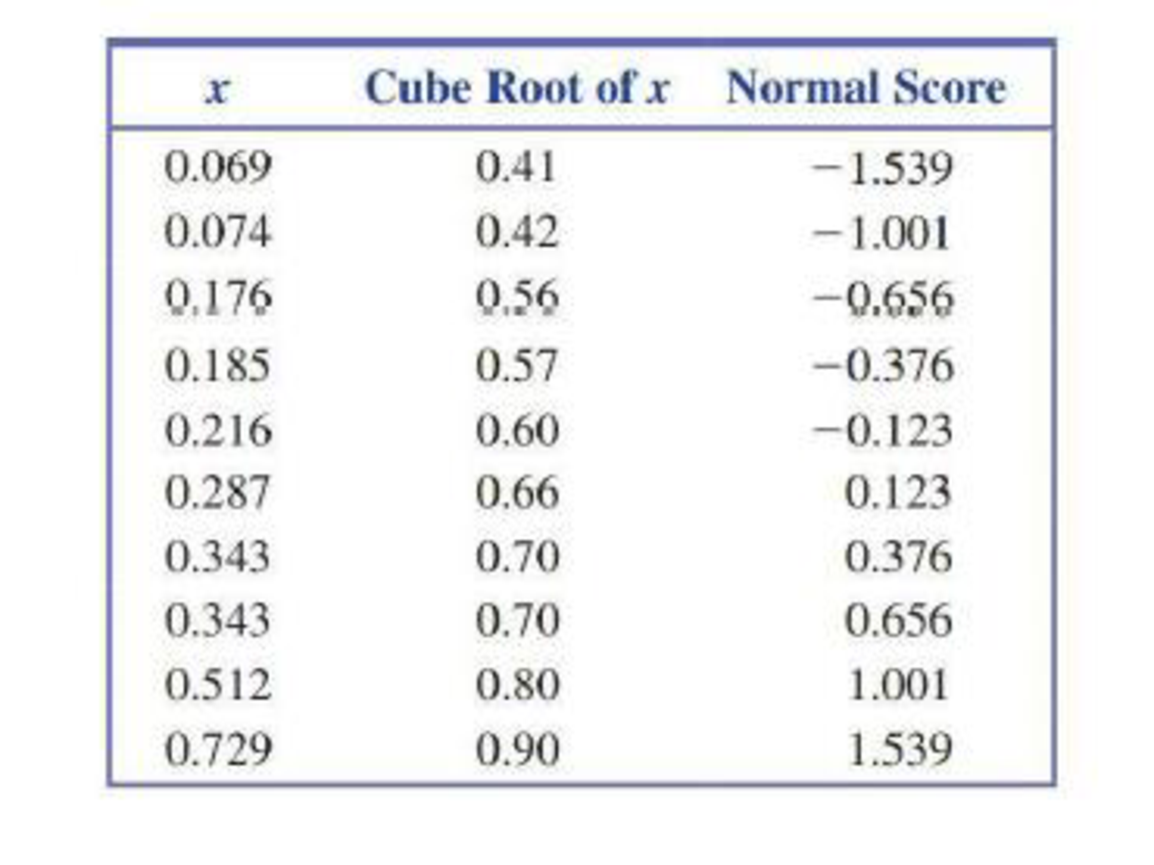
- a. Construct a normal
probability plot using the untransformed data. - b. Does the normal probability plot for the untransformed data appear linear or curved?
- c. Construct a normal probability plot using the cube-root transformed data. Does the normal probability plot appear more nearly linear than the plot for the untransformed data?

Trending nowThis is a popular solution!

Chapter 7 Solutions
Introduction To Statistics And Data Analysis


- Left ventricular mass (LVM) is an important risk factor for subsequent cardiovascular disease. A study is proposed to assess the relationship between childhood blood-pressure levels and LVM in children as determined from echocardiograms. The goal is to stratify children into a normal bp group (< 80th percentile for their age, gender, and height) and an elevated bp group (≥ 90th percentile for their age, gender, and height) and compare change in LVM between the two groups. Before this can be done, one needs to demonstrate that LVM actually changes in children over a 4-year period. To help plan the main study, a pilot study is conducted where echocardiograms are obtained from 10 random children from the Bogalusa Heart Study at baseline and after 4 years of follow-up. The data are given in Table 9.18 (Note: These are the same data as in Table 8.27, p. 329). 9.65 Suppose the investigators are reluctant to assume that the change in LVM over four years is normally distributed. What test…arrow_forwardLeft ventricular mass (LVM) is an important risk factor for subsequent cardiovascular disease. A study is proposed to assess the relationship between childhood blood-pressure levels and LVM in children as determined from echocardiograms. The goal is to stratify children into a normal bp group (< 80th percentile for their age, gender, and height)and an elevated bp group (≥ 90th percentile for their age, gender, and height) and compare change in LVM between the two groups. Before this can be done, one needs to demonstrate that LVM actually changes in children over a 4-year period. To help plan the main study, a pilot study is conducted where echocardiograms are obtained from 10 random children from the Bogalusa Heart Study at baseline and after4 years of follow-up. The data are given in images. a) Suppose the investigators are reluctant to assume that the change in LVM over four years is normally distributed. What test can be used to assess if there is a change in mean LVM over four…arrow_forwardLeft ventricular mass (LVM) is an important risk factor for subsequent cardiovascular disease. A study is proposed to assess the relationship between childhood blood-pressure levels and LVM in children as determined from echocardiograms. The goal is to stratify children into a normal bp group (< 80th percentile for their age, gender, and height)and an elevated bp group (≥ 90th percentile for their age, gender, and height) and compare change in LVM between the two groups. Before this can be done, one needs to demonstrate that LVM actually changes in children over a 4-year period. To help plan the main study, a pilot study is conducted where echocardiograms are obtained from 10 random children from the Bogalusa Heart Study at baseline and after4 years of follow-up. The data are given in images. Problem a)What is the two-sided p-value for this test?Problem b)Now perform the test using the exact method andobtain a 2-sided p-value.Problem c) Compare your results in Problems a and b.arrow_forward
- Left ventricular mass (LVM) is an important risk factor for subsequent cardiovascular disease. A study is proposed to assess the relationship between childhood blood-pressure levels and LVM in children as determined from echocardiograms. The goal is to stratify children into a normal bp group (< 90th percentile for their age, gender, and height) and an elevated bp group (≥ 90th percentile for their age, gender, and height) and compare change in LVM between the two groups. Before this can be done, one needs to demonstrate that LVM actually changes in children over a 4-year period. To help plan the main study, a pilot study is conducted where echocardiograms are obtained from 10 random children from the Bogalusa Heart Study at baseline and after 4 years of follow-up. The data are given in Table 1 . Table 1 Pilot data on left ventricular mass (LVM) in children from the Bogalusa Heart Study ID Baseline LVM (g) 4- year LVM (g) Change (g)* 1 139 163 24 2 134 126 -8 3 86 142 56…arrow_forwardLeft ventricular mass (LVM) is an important risk factor for subsequent cardiovascular disease. A study is proposed to assess the relationship between childhood blood-pressure levels and LVM in children as determined from echocardiograms. The goal is to stratify children into a normal bp group (< 80th percentile for their age, gender, and height) and an elevated bp group (≥ 90th percentile for their age, gender, and height) and compare change in LVM between the two groups. Before this can be done, one needs to demonstrate that LVM actually changes in children over a 4-year period.To help plan the main study, a pilot study is conducted where echocardiograms are obtained from 10 random children from the Bogalusa Heart Study at baseline and after 4 years of follow-up. The data are given in Table 9.18. A)Suppose the investigators are reluctant to assume that the change in LVM over four years is normally distributed. What test can be used to assess if there is a change in mean LVM over…arrow_forwardLeft ventricular mass (LVM) is an important risk factor for subsequent cardiovascular disease. A study is proposed to assess the relationship between childhood blood-pressure levels and LVM in children as determined from echocardiograms. The goal is to stratify children into a normal bp group (< 90th percentile for their age, gender, and height) and an elevated bp group (≥ 90th percentile for their age, gender, and height) and compare change in LVM between the two groups. Before this can be done, one needs to demonstrate that LVM actually changes in children over a 4-year period. To help plan the main study, a pilot study is conducted where echocardiograms are obtained from 10 random children from the Bogalusa Heart Study at baseline and after 4 years of follow-up. The data are given in Table 1 . Table 1 Pilot data on left ventricular mass (LVM) in children from the Bogalusa Heart Study ID Baseline LVM (g) 4- year LVM (g) Change (g)* 1 139 163 24 2 134 126 -8 3 86 142 56…arrow_forward
- Left ventricular mass (LVM) is an important risk factor for subsequent cardiovascular disease. A study is proposed to assess the relationship between childhood blood-pressure levels and LVM in children as determined from echocardiograms. The goal is to stratify children into a normal bp group (< 90th percentile for their age, gender, and height) and an elevated bp group (≥ 90th percentile for their age, gender, and height) and compare change in LVM between the two groups. Before this can be done, one needs to demonstrate that LVM actually changes in children over a 4-year period. To help plan the main study, a pilot study is conducted where echocardiograms are obtained from 10 random children from the Bogalusa Heart Study at baseline and after 4 years of follow-up. The data are given in Table 1 . Table 1 Pilot data on left ventricular mass (LVM) in children from the Bogalusa Heart Study ID Baseline LVM (g) 4- year LVM (g) Change (g)* 1 139 163 24 2 134 126 -8 3 86 142 56…arrow_forwardThe data in the attached image represents blood pressure based on a new trial medication used in an experiment involving a total of 50 male and female subjects. There were two levels of treatment: 0 = placebo and 1 = treatment group. Family History Blood Pressure = Fam-Hist-BP; from the paternal side = PS; from the maternal side = MS; from both sides = BS; none on both sides or not known = N.; Blood pressure before the experiment = BP-Before-Exp; Blood pressure after the experiment = BP-After-Exp. Task: Find the mean and standard deviation for the family history group, the before treatment group, and the after treatment group.arrow_forwardThe data in the attached image represents blood pressure based on a new trial medication used in an experiment involving a total of 50 male and female subjects. There were two levels of treatment: 0 = placebo and 1 = treatment group. Family History Blood Pressure = Fam-Hist-BP; from the paternal side = PS; from the maternal side = MS; from both sides = BS; none on both sides or not known = N.; Blood pressure before the experiment = BP-Before-Exp; Blood pressure after the experiment = BP-After-Exp. Task: Construct a side-by-side boxplot to compare the variables BP-Before-Exp and BP-After-Exp.arrow_forward
- The data in the attached image represents blood pressure based on a new trial medication used in an experiment involving a total of 50 male and female subjects. There were two levels of treatment: 0 = placebo and 1 = treatment group. Family History Blood Pressure = Fam-Hist-BP; from the paternal side = PS; from the maternal side = MS; from both sides = BS; none on both sides or not known = N.; Blood pressure before the experiment = BP-Before-Exp; Blood pressure after the experiment = BP-After-Exp. Task: Construct a scatterplot to display the relationship and find the correlation between age and BP-Before Exp.arrow_forwardThe data in the attached image represents blood pressure based on a new trial medication used in an experiment involving a total of 50 male and female subjects. There were two levels of treatment: 0 = placebo and 1 = treatment group. Family History Blood Pressure = Fam-Hist-BP; from the paternal side = PS; from the maternal side = MS; from both sides = BS; none on both sides or not known = N.; Blood pressure before the experiment = BP-Before-Exp; Blood pressure after the experiment = BP-After-Exp. Task: Construct a histogram to represent the family BP history, the subjects' BP before treatment and the subjects' BP after treatment.arrow_forwardThe data in the attached image represents blood pressure based on a new trial medication used in an experiment involving a total of 50 male and female subjects. There were two levels of treatment: 0 = placebo and 1 = treatment group. Family History Blood Pressure = Fam-Hist-BP; from the paternal side = PS; from the maternal side = MS; from both sides = BS; none on both sides or not known = N.; Blood pressure before the experiment = BP-Before-Exp; Blood pressure after the experiment = BP-After-Exp. Task: Construct a scatterplot to display the relationship and find the correlation between BP-Before-Exp and BP-After-Exp.arrow_forward
 Glencoe Algebra 1, Student Edition, 9780079039897...AlgebraISBN:9780079039897Author:CarterPublisher:McGraw Hill
 Big Ideas Math A Bridge To Success Algebra 1: Stu...AlgebraISBN:9781680331141Author:HOUGHTON MIFFLIN HARCOURTPublisher:Houghton Mifflin Harcourt