
Concept explainers
Videos
The density curve for the random variable w (the sum of two wait times) is given in the previous exercise. What is the
7.31 Ref erring to the previous exercise, let x and y be waiting times on two independently selected days. Define a new random variable w by
w =x + y
the sum of the two waiting times. The set of possible values for w is the interval from 0 to 40 (because both x and y can
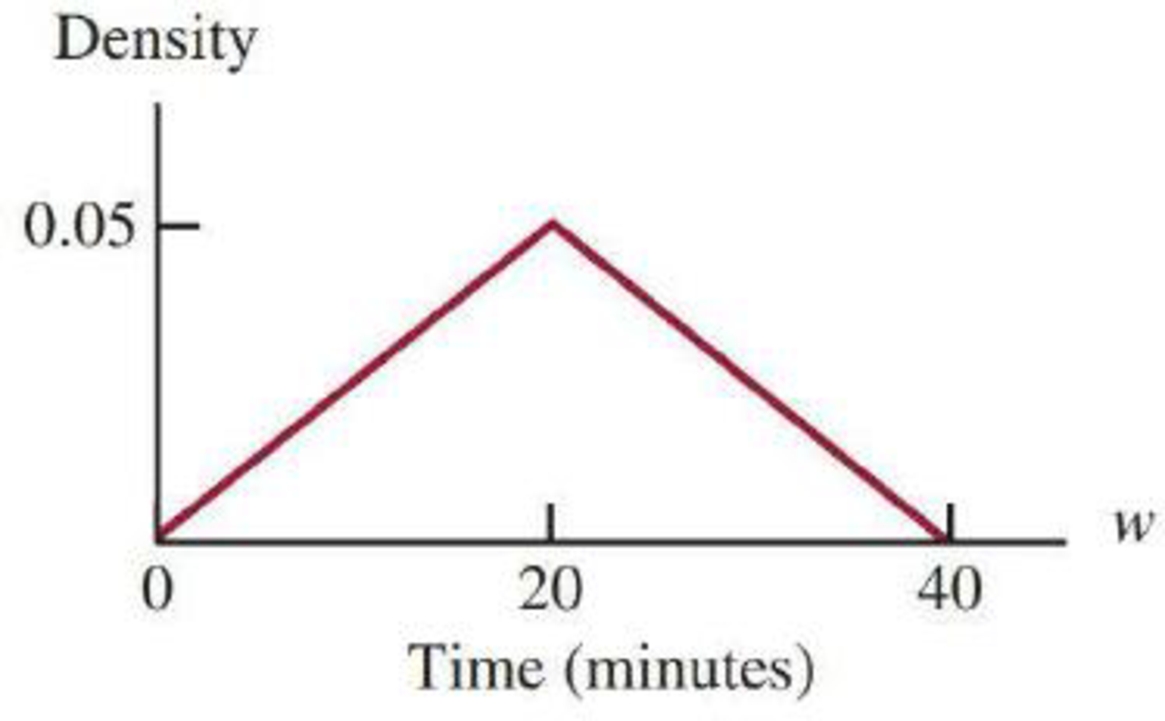
- a. Verify that the total area under the density curve is equal to 1.
(Hint: Area of a triangle =
- b. What is the probability that w is less than 20?
- c. What is the probability that w is less than 10?
- d. What is the probability that w is greater than 30?
7.30 Let x be the amount of time (in minutes) that a particular San Francisco commuter must wait for a train. Suppose that the density curve is as pictured (a uniform distribution):
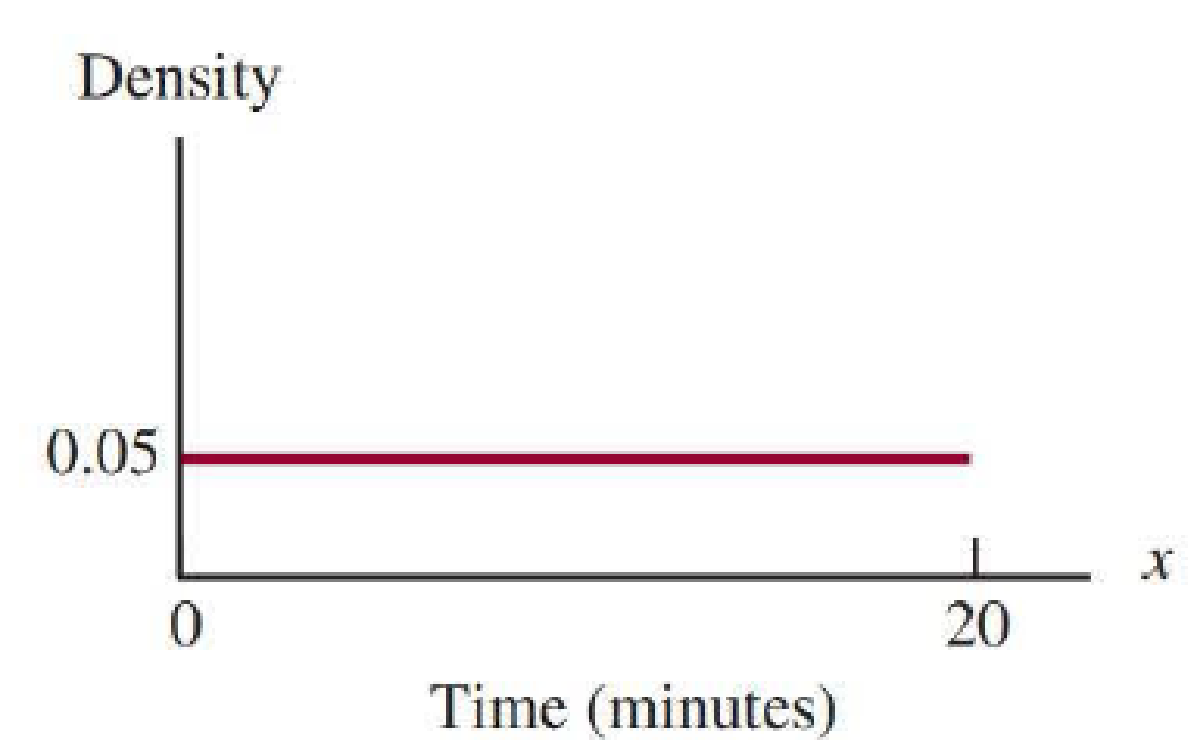
- a. What is the probability that x is less than 10 minutes? more than 15 minutes?
- b. What is the probability that x is between 7 and 12 minutes?
- c. Find the value c for which P(x < c) = 0.9.

Trending nowThis is a popular solution!

Chapter 7 Solutions
Introduction To Statistics And Data Analysis


 Calculus For The Life SciencesCalculusISBN:9780321964038Author:GREENWELL, Raymond N., RITCHEY, Nathan P., Lial, Margaret L.Publisher:Pearson Addison Wesley,
 Holt Mcdougal Larson Pre-algebra: Student Edition...AlgebraISBN:9780547587776Author:HOLT MCDOUGALPublisher:HOLT MCDOUGAL
 Algebra & Trigonometry with Analytic GeometryAlgebraISBN:9781133382119Author:SwokowskiPublisher:Cengage
 College AlgebraAlgebraISBN:9781305115545Author:James Stewart, Lothar Redlin, Saleem WatsonPublisher:Cengage Learning