
Statistics for Engineers and Scientists
4th Edition
ISBN: 9780073401331
Author: William Navidi Prof.
Publisher: McGraw-Hill Education
expand_more
expand_more
format_list_bulleted
Videos
Textbook Question
Chapter 7.4, Problem 12E
The article “The Selection of Yeast Strains for the Production of Premium Quality South African Brandy Base Products” (C. Steger and M. Lambrechts, Journal of Industrial Microbiology and Biotechnology, 2000:431–440) presents detailed information on the volatile compound composition of base wines made from each of 16 selected yeast strains. Below are the concentrations of total esters and total volatile acids (in mg/L) in each of the wines.
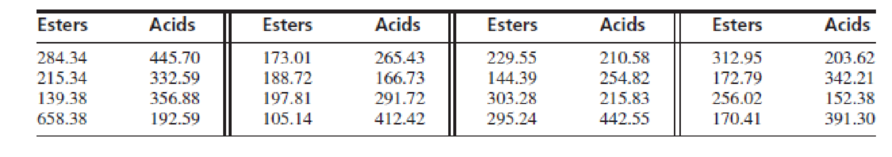
- a. Construct a
scatterplot of acid concentration versus ester concentration. Indicate the outlier. - b. Compute the coefficients of the least-squares line for predicting acid level (y) from ester level (x), along with their estimated standard deviations.
- c. Compute the P-value of the test of the null hypothesis H0 : β1 = 0.
- d. Delete the outlier, and recompute the coefficients of the least-squares line, along with their estimated standard deviations.
- e. Compute the P-value of the test of the null hypothesis H0 : β1 = 0 for the data with the outlier deleted.
- f. Does a linear model appear to be useful for predicting acid concentration from ester concentration? Explain.
Expert Solution & Answer
Want to see the full answer?
Check out a sample textbook solution
Students have asked these similar questions
The article "The Selection of Yeast Strains for the Production of Premium Quality South
African Brandy Base Products" (C. Steger and M. Lambrechts, Journal of Industrial
Microbiology and Biotechnology, 2000:431-440) presents detailed information on the
volatile compound composition of base wines made from each of 16 selected yeast strains.
Following are the concentrations of total esters (in mg/L) in each of the wines.
284.34
173.01
229.55
312.95
215.34
188.72
144.39
172.79
139.38
197.81
303.28
256.02
658.38
105.14
295.24
170.41
Compute the mean concentration.
a.
b.
Compute the median concentration.
Compute the first quartile of the concentrations.
C.
d.
Compute the third quartile of the concentrations.
Construct a boxplot for the concentrations. What features does it reveal?
e.
The article “The Selection of Yeast Strains for the Production of Premium Quality South African Brandy Base Products ” (C. Steger and M. Lambrechts, Journal of Industrial Microbiology and Biotechnology, 2000:431– 440) presents detailed information on the volatile compound composition of base wines made from each of 16 selected yeast strains. Following are the concentrations of total esters (in mg/L) in each of the wines.
105.14
139.38
144.39
170.41
172.79
173.01
188.72
197.81
215.34
229.55
256.02
284.34
295.24
303.28
312.95
658.38
the 10th , 60th and 90th percentiles are given by (in that order);
Select one:
a.
122.25 , 222.44, 308.11
b.
139.38, 215.34, 312.95
c.
122.26, 242.79, 485.67
d.
141.88, 242.78, 485.66
e.
122.26 , 242.79, 312.95
& The accompanying table gives plasma epinephrine
concentration for ten experimental subjects during
(1) isoflurane, (2) halothane, and (3) cyclopropane
anesthesia ("Sympathoadrenal and Hemodynamic
Effects of Isoflurane, Halothane, and Cyclopropane
in Dogs." Anesthesiology, 1974: 465-470).
a. Does the choice of anesthetic affect true average
concentration? Test H: a, = a, = a, = 0 at
level .05 after constructing the ANOVA table.
%3D
Subject (B)
2
3
4
5
.51 1.00
.39
28
.39
29
Anesthetic
38
.21
2 .30
3 1.07 1.35
.63
(A)
.69
.28 1.24
6.
7
8
10
33
17
.32
.56 1.02
.69
.32
.39
1
.36
Anesthetic
2
.88
51
.42
(A)
3 1.53
49
.30
ΣΣή-13.7980
Chapter 7 Solutions
Statistics for Engineers and Scientists
Ch. 7.1 - Compute the correlation coefficient for the...Ch. 7.1 - For each of the following data sets, explain why...Ch. 7.1 - For each of the following scatterplots, state...Ch. 7.1 - True or false, and explain briefly: a. If the...Ch. 7.1 - In a study of ground motion caused by earthquakes,...Ch. 7.1 - A chemical engineer is studying the effect of...Ch. 7.1 - Another chemical engineer is studying the same...Ch. 7.1 - Tire pressure (in kPa) was measured for the right...Ch. 7.1 - Prob. 10ECh. 7.1 - The article Drift in Posturography Systems...
Ch. 7.1 - Prob. 12ECh. 7.1 - Prob. 13ECh. 7.1 - A scatterplot contains four points: (2, 2), (1,...Ch. 7.2 - Each month for several months, the average...Ch. 7.2 - In a study of the relationship between the Brinell...Ch. 7.2 - A least-squares line is fit to a set of points. If...Ch. 7.2 - Prob. 4ECh. 7.2 - In Galtons height data (Figure 7.1, in Section...Ch. 7.2 - In a study relating the degree of warping, in mm....Ch. 7.2 - Moisture content in percent by volume (x) and...Ch. 7.2 - The following table presents shear strengths (in...Ch. 7.2 - Structural engineers use wireless sensor networks...Ch. 7.2 - The article Effect of Environmental Factors on...Ch. 7.2 - An agricultural scientist planted alfalfa on...Ch. 7.2 - Curing times in days (x) and compressive strengths...Ch. 7.2 - Prob. 13ECh. 7.2 - An engineer wants to predict the value for y when...Ch. 7.2 - A simple random sample of 100 men aged 2534...Ch. 7.2 - Prob. 16ECh. 7.3 - A chemical reaction is run 12 times, and the...Ch. 7.3 - Structural engineers use wireless sensor networks...Ch. 7.3 - Prob. 3ECh. 7.3 - Prob. 4ECh. 7.3 - Prob. 5ECh. 7.3 - Prob. 6ECh. 7.3 - The coefficient of absorption (COA) for a clay...Ch. 7.3 - Prob. 8ECh. 7.3 - Prob. 9ECh. 7.3 - Three engineers are independently estimating the...Ch. 7.3 - In the skin permeability example (Example 7.17)...Ch. 7.3 - Prob. 12ECh. 7.3 - In a study of copper bars, the relationship...Ch. 7.3 - Prob. 14ECh. 7.3 - In the following MINITAB output, some of the...Ch. 7.3 - Prob. 16ECh. 7.3 - In order to increase the production of gas wells,...Ch. 7.4 - The following output (from MINITAB) is for the...Ch. 7.4 - The processing of raw coal involves washing, in...Ch. 7.4 - To determine the effect of temperature on the...Ch. 7.4 - The depth of wetting of a soil is the depth to...Ch. 7.4 - Good forecasting and control of preconstruction...Ch. 7.4 - The article Drift in Posturography Systems...Ch. 7.4 - Prob. 7ECh. 7.4 - Prob. 8ECh. 7.4 - A windmill is used to generate direct current....Ch. 7.4 - Two radon detectors were placed in different...Ch. 7.4 - Prob. 11ECh. 7.4 - The article The Selection of Yeast Strains for the...Ch. 7.4 - Prob. 13ECh. 7.4 - The article Characteristics and Trends of River...Ch. 7.4 - Prob. 15ECh. 7.4 - The article Mechanistic-Empirical Design of...Ch. 7.4 - An engineer wants to determine the spring constant...Ch. 7 - The BeerLambert law relates the absorbance A of a...Ch. 7 - Prob. 2SECh. 7 - Prob. 3SECh. 7 - Refer to Exercise 3. a. Plot the residuals versus...Ch. 7 - Prob. 5SECh. 7 - The article Experimental Measurement of Radiative...Ch. 7 - Prob. 7SECh. 7 - Prob. 8SECh. 7 - Prob. 9SECh. 7 - Prob. 10SECh. 7 - The article Estimating Population Abundance in...Ch. 7 - A materials scientist is experimenting with a new...Ch. 7 - Monitoring the yield of a particular chemical...Ch. 7 - Prob. 14SECh. 7 - Refer to Exercise 14. Someone wants to compute a...Ch. 7 - Prob. 16SECh. 7 - Prob. 17SECh. 7 - Prob. 18SECh. 7 - Prob. 19SECh. 7 - Use Equation (7.34) (page 545) to show that 1=1.Ch. 7 - Use Equation (7.35) (page 545) to show that 0=0.Ch. 7 - Prob. 22SECh. 7 - Use Equation (7.35) (page 545) to derive the...
Additional Math Textbook Solutions
Find more solutions based on key concepts
Complete each statement with the correct term from the column on the right. Some of the choices may not be used...
Intermediate Algebra (13th Edition)
153. A rain gutter is made from sheets of aluminum that are 20 inches wide. As shown in the figure, the edges ...
College Algebra (7th Edition)
For Problems 23-28, write in simpler form, as in Example 4. logbFG
Finite Mathematics for Business, Economics, Life Sciences and Social Sciences
1. How is a sample related to a population?
Elementary Statistics: Picturing the World (7th Edition)
Check Your Understanding
Reading Check Complete each sentence using > or < for □.
RC1. 3 dm □ 3 dam
Basic College Mathematics
Knowledge Booster


Learn more about
Need a deep-dive on the concept behind this application? Look no further. Learn more about this topic, statistics and related others by exploring similar questions and additional content below.Similar questions
- PCBs and Pelicans. Polychlorinated biphenyls (PCBs), industrial pollutants, are known to be carcinogens and a great danger to natural ecosystems. As a result of several studies, PCB production was banned in the United States in 1979 and by the Stockholm Convention on Persistent Organic Pollutants in 2001. One study, published in 1972 by R. W. Risebrough, is titled ‘‘Effects of Environmental Pollutants Upon Animals Other Than Man’’ (Proceedings of the 6th Berkeley Symposium on Mathematics and Statistics, VI, University of California Press, pp. 443–463). In that study, 60 Anacapa pelican eggs were collected and measured for their shell thickness, in millimeters (mm), and concentration of PCBs, in parts per million (ppm). Following is a relative-frequency histogram of the PCB concentration data.arrow_forwardPCBs and Pelicans. Polychlorinated biphenyls (PCBs), industrial pollutants, are known to be carcinogens and a great danger to natural ecosystems. As a result of several studies, PCB production was banned in the United States in 1979 and by the Stockholm Convention on Persistent Organic Pollutants in 2001. One study, published in 1972 by R. Risebrough, is titled “Effects of Environmental Pollutants Upon Animals Other Than Man” (Proceedings of the 6th Berkeley Symposium on Mathematics and Statistics, VI, University of California Press, pp. 443–463). In that study, 60 Anacapa pelican eggs were collected and measured for their shell thickness, in millimeters (mm), and concentration of PCBs, in parts per million (ppm). The data are on the WeissStats site. a. obtain and interpret the standard error of the estimate. b. obtain a residual plot and a normal probability plot of the residuals. c. decide whether you can reasonably consider Assumptions 1–3 for regression inferences met by the two…arrow_forwardDetermine the hypothesis using APA formatarrow_forward
- The comparative boxplot (see below) of gasoline vapor coefficients for vehicles in Detroit appeared in the article "Receptor Modeling Approach to VOC Emission Inventory Validation" (J. of Envir. Engr., 1995: 483-490). Discuss any interesting features. Gas vapor coefficient 70 60 50 40 30 20 Time 6A.M. 8A.M. 12noon 2P.M. 10P.M. 10arrow_forward14) Penicillin is produced by the Penicillin fungus, which is grown in a broth whose sugar be carefully controlled. Several samples of broth were taken on three successive days, and the amount of dissolved sugars, in milligrams per milliliter, was measured on each sample. The results were as follows.arrow_forward1. Soil samples were collected at two areas surrounding an abandoned mine and analyzed for lead. At each area several samples were taken. The soil was extracted with acid, and the extract was analyzed using flame atomic absorption spectrometry. In Area A, Pb concentrations were 1.2, 1.0, 0.9, 1.4 mg/kg. In Area B, Pb concentrations were 0.7, 1.0, 0.5, 0.6, 0.4 mg/kg. Are these two areas significantly different from each other with Pb concentrations at 90% confidence level?arrow_forward
- An investigation was conducted into the dust content in the flue gases of two types of solid-fuel boilers. Thirteen boilers of type A and nine boilers of type B were used under identical fueling and extraction conditions. Over a similar period, the quantities of dust were deposited in similar traps inserted in each of the twenty-two flues. Presented below are the collected dust content (in grams) given the source broiler type. Type A 73.1 56.4 82.1 67.2 78.7 75.1 48.0 53.3 55.5 61.5 60.6 55.2 63.1 Type B 53.0 39.3 55.8 58.8 41.2 66.6 46.0 56.4 58.9 questions are in inserted imagearrow_forwardIn August and September 2005, Hurricanes Katrina and Rita caused extraordinary flooding in New Orleans, Louisiana. Many homes were severely damaged or destroyed; of those that survived, many required extensive cleaning. It was thought that cleaning flood-damaged homes might present a health hazard due to the large amounts of mold present in many of the homes. The article “Health Effects of Exposure to Water-Damaged New Orleans Homes Six Months After Hurricanes Katrina and Rita” (K. Cummings, J. Cox-Ganser, et al., American Journal of Public Health, 2008:869–875) reports that in a sample of 365 residents of Orleans Parish who had participated in the cleaning of one or more homes, 77 had experienced symptoms of wheezing, and in a sample of 179 residents who had not participated in cleaning, 23 reported wheezing symptoms (numbers read from a graph). Can you conclude that the frequency of wheezing symptoms is greater among those residents who participated in the cleaning of flood-damaged…arrow_forwardCheek teeth of extinct primates. The characteristics of cheek teeth (e.g., molars) can provide anthropologists with information on the dietary habits of extinct mammals. The cheek teeth of an extinct primate species were the subject of research reported in the American Journal of Physical Anthropology (Vol. 142, 2010). A total of 18 cheek teeth extracted from skulls discovered in western Wyoming were analyzed. Researchers recorded the dentary depth of molars (in millimeters) for a sample of 18 cheek teeth extracted from skulls. These depth measurements are listed in the accompanying table. Anthropologists know that the mean dentary depth of molars in an extinct primate species— called Species A—is 15 millimeters. Is there evidence to indicate that the sample of 18 cheek teeth come from some other extinct primate species (i.e., some species other than Species A)? The data are given below (you will need to put it into a single column). You will need to calculate the sample…arrow_forward
- Pond’s Age-Defying Complex, a cream with alpha-hydroxy acid, advertises that it can reduce wrinkles and improve the skin. In a study published in Archives of Dermatology (June 1996), 33 women over age 40 used a cream with alpha-hydroxy acid for twenty-two weeks. At the end of the study period, 23 of the women exhibited skin improvement (as judged by a dermatologist). A.) What is the parameter being used in this problem?arrow_forwardOne of the markers of toxicity of a proposed drug during drug development is loss of weight in the exposed individuals. Female was exposed to a proposed drug and the effects were observed during a 28 days period. Another record only the vehicle. These two groups were animals of similar age and gender and were all treated in similar ways regarding nutrition, water and environment. Result of the weight of 16 male mice before and after treatment are tabulated in table 2 below: Table 2: Table of the weights (gm) of 16 male mice before (X1a) and after treatment (X1b) X1a 20 21.2 20.6 19.5 18.9 20.2 21 19.6 17.8 18.5 18.3 19.2 19.6 19.4 19.2 19 X1b 20.9 21.9 21.2 21 19.9 20.9 21.8 21 18.6 19.9 19 20 20.1 20 20 20.7 Determine if these was a statistical weight difference (gain/loss in the 2 groups) Using paired t-testarrow_forwardThe article "Characterization of Effects of Thermal Property of Aggregate on the Carbon Footprint of Asphalt Industries in China" (A. Jamshidi, K. Kkurumisawa, et al., Journal of Traffic and Transportation Engineering 2017: 118-130) presents the results measurements of CO, emissions produced during the manufacture of asphalt. Three measurements were taken at each of three mixing temperatures. The results are presented in the following table: Temperature (*C) Emissions (100kt) 160 9.52 14.10 7.43 145 8.37 6.54 12.40 130 7.24 10.70 5.66 Construct an ANOVA table. You may give a range for the P-value. Can you conclude that the mean emissions differ with mixing temperature? a.arrow_forward
arrow_back_ios
SEE MORE QUESTIONS
arrow_forward_ios
Recommended textbooks for you
 MATLAB: An Introduction with ApplicationsStatisticsISBN:9781119256830Author:Amos GilatPublisher:John Wiley & Sons Inc
 Probability and Statistics for Engineering and th...StatisticsISBN:9781305251809Author:Jay L. DevorePublisher:Cengage Learning
 Statistics for The Behavioral Sciences (MindTap C...StatisticsISBN:9781305504912Author:Frederick J Gravetter, Larry B. WallnauPublisher:Cengage Learning
 Elementary Statistics: Picturing the World (7th E...StatisticsISBN:9780134683416Author:Ron Larson, Betsy FarberPublisher:PEARSON
 The Basic Practice of StatisticsStatisticsISBN:9781319042578Author:David S. Moore, William I. Notz, Michael A. FlignerPublisher:W. H. Freeman
 Introduction to the Practice of StatisticsStatisticsISBN:9781319013387Author:David S. Moore, George P. McCabe, Bruce A. CraigPublisher:W. H. Freeman
MATLAB: An Introduction with Applications
Statistics
ISBN:9781119256830
Author:Amos Gilat
Publisher:John Wiley & Sons Inc
Probability and Statistics for Engineering and th...
Statistics
ISBN:9781305251809
Author:Jay L. Devore
Publisher:Cengage Learning
Statistics for The Behavioral Sciences (MindTap C...
Statistics
ISBN:9781305504912
Author:Frederick J Gravetter, Larry B. Wallnau
Publisher:Cengage Learning
Elementary Statistics: Picturing the World (7th E...
Statistics
ISBN:9780134683416
Author:Ron Larson, Betsy Farber
Publisher:PEARSON
The Basic Practice of Statistics
Statistics
ISBN:9781319042578
Author:David S. Moore, William I. Notz, Michael A. Fligner
Publisher:W. H. Freeman
Introduction to the Practice of Statistics
Statistics
ISBN:9781319013387
Author:David S. Moore, George P. McCabe, Bruce A. Craig
Publisher:W. H. Freeman
Hypothesis Testing using Confidence Interval Approach; Author: BUM2413 Applied Statistics UMP;https://www.youtube.com/watch?v=Hq1l3e9pLyY;License: Standard YouTube License, CC-BY
Hypothesis Testing - Difference of Two Means - Student's -Distribution & Normal Distribution; Author: The Organic Chemistry Tutor;https://www.youtube.com/watch?v=UcZwyzwWU7o;License: Standard Youtube License