Concept explainers
(a)
To graph: The population distribution given that there are 3000 students in this school.
(a)
Explanation of Solution
Given information:
Percent of students who did their assigned homework last week = 60%
Number of students for SRS = 100
The dotplot:

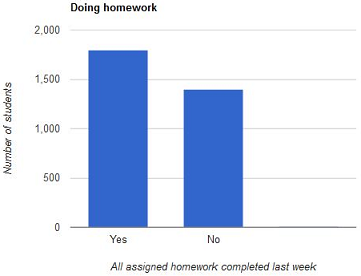
Given that the number of students in the school is 3000 and the percent of students who did all their homework last week is 60%.
So, the number of students who did their homework last week is,
To find the number of students who did not do their homework last week, subtract 1800 from 3000.
The required graph of the population distribution is shown below:

In the above graph, the widths of the bars are equal and the heights of the bars are shown according to the number of students.
(b)
To graph: The distribution of sample data for the SRS of size 100 taken by the AP Statistics students.
(b)
Explanation of Solution
Given information:
Percent of students who did their assigned homework last week = 60%
Number of students for SRS = 100
The dotplot:

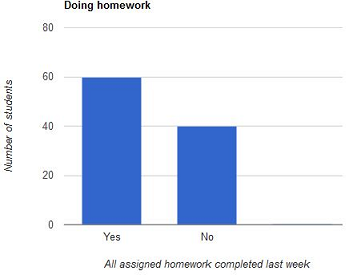
Given that the number of students in the sample is 100.
Percent of students of who did their homework last week is 60%.
Thus the number of students who did their homework from the sample of 100 students is,
To find the number of students who did not their homework last week from the sample of 100 students, subtract 60 from 100.
The required graph of the population distribution is shown below:

In the above graph, the widths of the bars are equal and the heights of the bars are shown according to the number of students.
Chapter 7 Solutions
The Practice of Statistics for AP - 4th Edition
Additional Math Textbook Solutions
Elementary Statistics: Picturing the World (7th Edition)
Algebra and Trigonometry (6th Edition)
Pre-Algebra Student Edition
Thinking Mathematically (6th Edition)
Intro Stats, Books a la Carte Edition (5th Edition)
University Calculus: Early Transcendentals (4th Edition)
 MATLAB: An Introduction with ApplicationsStatisticsISBN:9781119256830Author:Amos GilatPublisher:John Wiley & Sons Inc
 Probability and Statistics for Engineering and th...StatisticsISBN:9781305251809Author:Jay L. DevorePublisher:Cengage Learning
 Statistics for The Behavioral Sciences (MindTap C...StatisticsISBN:9781305504912Author:Frederick J Gravetter, Larry B. WallnauPublisher:Cengage Learning
 Elementary Statistics: Picturing the World (7th E...StatisticsISBN:9780134683416Author:Ron Larson, Betsy FarberPublisher:PEARSON
 The Basic Practice of StatisticsStatisticsISBN:9781319042578Author:David S. Moore, William I. Notz, Michael A. FlignerPublisher:W. H. Freeman
 Introduction to the Practice of StatisticsStatisticsISBN:9781319013387Author:David S. Moore, George P. McCabe, Bruce A. CraigPublisher:W. H. Freeman


