
Concept explainers
Videos
(a)
Whether the distribution is the sampling distribution of
(a)
Answer to Problem 10E
The distribution is not the sampling distribution of
Explanation of Solution
Given information:
Mean,
Standard deviation,
Number of 16-year old females = 300
Number of 16-year old females for SRS = 20
The population distribution =
The dotplot:

Here, the sampling distribution should contain all possible
But in the given distribution, the dotplot contains 250 results of random samples whose size is 20.
Hence, the distribution is not the sampling distribution of
(b)
The description of the distribution. Also, find whether there are any obvious outliers or not.
(b)
Answer to Problem 10E
The histogram has 2 outliers.
Explanation of Solution
Given information:
Mean,
Standard deviation,
Number of 16-year old females = 300
Number of 16-year old females for SRS = 20
The population distribution =
The dotplot:
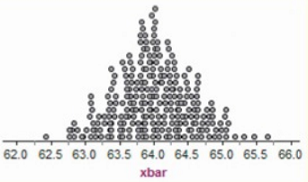
The highest peak is roughly in the middle of the histogram; so the shape of the histogram is roughly unimodal and symmetric. Also, the highest peak of the histogram is at about 64.0. This means, the distribution is centered at 64.0. It is also seen that the values of data vary from 62.5 to 65.7 in the histogram.
Observe that there is one outlier on each side of the dotplot. This means the histogram has total 2 outliers and they are 62.5 and 65.7.
Hence, the histogram has 2 outliers.
(c)
The conclusion about the population mean height
(c)
Answer to Problem 10E
The given claim is true.
Explanation of Solution
Given information:
Mean,
Standard deviation,
Number of 16-year old females = 300
Number of 16-year old females for SRS = 20
The population distribution =
The dotplot:

The given population distribution is
It is seen n the dotplot that above 64.7 there are a lot of dots and a lot dots to its right side.
This means that if the population distribution is
Hence, it is concluded that the claim is true.
Chapter 7 Solutions
The Practice of Statistics for AP - 4th Edition
Additional Math Textbook Solutions
Elementary Statistics
Elementary Statistics: Picturing the World (6th Edition)
Elementary Statistics (13th Edition)
Introductory Statistics (2nd Edition)
Elementary Statistics: Picturing the World (7th Edition)
Statistics: The Art and Science of Learning from Data (4th Edition)


 MATLAB: An Introduction with ApplicationsStatisticsISBN:9781119256830Author:Amos GilatPublisher:John Wiley & Sons Inc
 Probability and Statistics for Engineering and th...StatisticsISBN:9781305251809Author:Jay L. DevorePublisher:Cengage Learning
 Statistics for The Behavioral Sciences (MindTap C...StatisticsISBN:9781305504912Author:Frederick J Gravetter, Larry B. WallnauPublisher:Cengage Learning
 Elementary Statistics: Picturing the World (7th E...StatisticsISBN:9780134683416Author:Ron Larson, Betsy FarberPublisher:PEARSON
 The Basic Practice of StatisticsStatisticsISBN:9781319042578Author:David S. Moore, William I. Notz, Michael A. FlignerPublisher:W. H. Freeman
 Introduction to the Practice of StatisticsStatisticsISBN:9781319013387Author:David S. Moore, George P. McCabe, Bruce A. CraigPublisher:W. H. Freeman