Concept explainers
a.
To construct: A graph of 5 data points with the
a.
Explanation of Solution
Given:
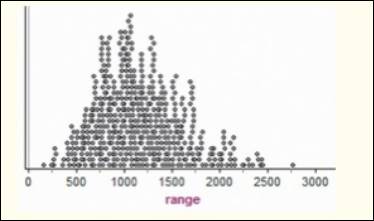
Figure is:

Calculation:
Consider, the numbers are 2800, 3000, 3200, 3400, 3800.
The figure could be constructed as:

b.
To explain: The reason of sample range of above constructed not being equal to the actual distribution.
b.
Explanation of Solution
The range of both the distributions is not equal because the provided data plot has the range of 500 samples while the actual one has the sample range for the all the sample of 500 size.
Chapter 7 Solutions
The Practice of Statistics for AP - 4th Edition
Additional Math Textbook Solutions
Algebra and Trigonometry (6th Edition)
Intro Stats, Books a la Carte Edition (5th Edition)
College Algebra (7th Edition)
Calculus for Business, Economics, Life Sciences, and Social Sciences (14th Edition)
Elementary Statistics: Picturing the World (7th Edition)
A First Course in Probability (10th Edition)
- Please could you explain why 0.5 was added to each upper limpit of the intervals.Thanksarrow_forward28. (a) Under what conditions do we say that two random variables X and Y are independent? (b) Demonstrate that if X and Y are independent, then it follows that E(XY) = E(X)E(Y); (e) Show by a counter example that the converse of (ii) is not necessarily true.arrow_forward1. Let X and Y be random variables and suppose that A = F. Prove that Z XI(A)+YI(A) is a random variable.arrow_forward
- (c) Utilize Fubini's Theorem to demonstrate that E(X)= = (1- F(x))dx.arrow_forward(c) Describe the positive and negative parts of a random variable. How is the integral defined for a general random variable using these components?arrow_forward26. (a) Provide an example where X, X but E(X,) does not converge to E(X).arrow_forward
 MATLAB: An Introduction with ApplicationsStatisticsISBN:9781119256830Author:Amos GilatPublisher:John Wiley & Sons Inc
 Probability and Statistics for Engineering and th...StatisticsISBN:9781305251809Author:Jay L. DevorePublisher:Cengage Learning
 Statistics for The Behavioral Sciences (MindTap C...StatisticsISBN:9781305504912Author:Frederick J Gravetter, Larry B. WallnauPublisher:Cengage Learning
 Elementary Statistics: Picturing the World (7th E...StatisticsISBN:9780134683416Author:Ron Larson, Betsy FarberPublisher:PEARSON
 The Basic Practice of StatisticsStatisticsISBN:9781319042578Author:David S. Moore, William I. Notz, Michael A. FlignerPublisher:W. H. Freeman
 Introduction to the Practice of StatisticsStatisticsISBN:9781319013387Author:David S. Moore, George P. McCabe, Bruce A. CraigPublisher:W. H. Freeman


