
Concept explainers
Videos
(a)
To construct a histogram showing the distribution of the number of broken pieces in the
(a)
Explanation of Solution
The histogram showing the distribution of the number of broken pieces in the
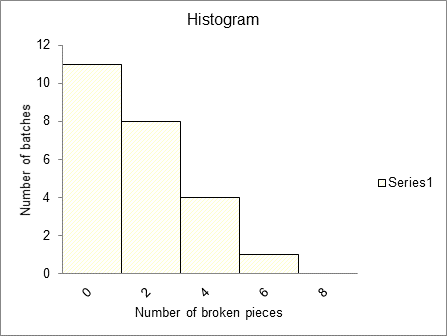
The horizontal axis is the number of broken pieces and the vertical axis is the number of batches.
(b)
To describe the distribution as shown in the histogram and find out what feature of the problem is more apparent in the histogram than in the
(b)
Explanation of Solution
As we see in the histogram of part (a), we can say that the histogram is uni-modal as there is only one
(c)
To find out what aspect of the company’s problem is more apparent in the scatterplot.
(c)
Explanation of Solution
It shows the relationship of the number of broken pieces and the number of batches. It shows that the histogram is positive and also somewhat there is a linear relation between the number of batch number and the number of broken pieces. As there is more batches there is more number of broken pieces.
Chapter 7 Solutions
Stats: Modeling the World Nasta Edition Grades 9-12
Additional Math Textbook Solutions
Elementary Statistics (13th Edition)
Essentials of Statistics, Books a la Carte Edition (5th Edition)
Introductory Statistics
Elementary Statistics Using Excel (6th Edition)
Introductory Statistics (2nd Edition)


 MATLAB: An Introduction with ApplicationsStatisticsISBN:9781119256830Author:Amos GilatPublisher:John Wiley & Sons Inc
 Probability and Statistics for Engineering and th...StatisticsISBN:9781305251809Author:Jay L. DevorePublisher:Cengage Learning
 Statistics for The Behavioral Sciences (MindTap C...StatisticsISBN:9781305504912Author:Frederick J Gravetter, Larry B. WallnauPublisher:Cengage Learning
 Elementary Statistics: Picturing the World (7th E...StatisticsISBN:9780134683416Author:Ron Larson, Betsy FarberPublisher:PEARSON
 The Basic Practice of StatisticsStatisticsISBN:9781319042578Author:David S. Moore, William I. Notz, Michael A. FlignerPublisher:W. H. Freeman
 Introduction to the Practice of StatisticsStatisticsISBN:9781319013387Author:David S. Moore, George P. McCabe, Bruce A. CraigPublisher:W. H. Freeman