Concept explainers
(a)
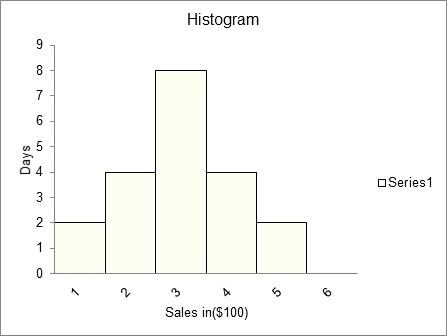
To construct a histogram of the daily sales since the shop has been in business.
(a)
Explanation of Solution
The histogram of the daily sales is as follows:

The horizontal axis is the sales and the vertical axis is the days.
(b)
To state one fact that is obvious from the
(b)
Answer to Problem 10E
It is positive, linear and moderately strong.
Explanation of Solution
The one fact that is obvious from the scatterplot but not from the histogram is that the relationship is positive, linear and moderately strong. You can see the comparison between sales and days and also see the trend over time from the scatterplot but not from the histogram. Thus, it is the benefit of the scatterplot over the histogram.
(c)
To state one fact that is obvious from the histogram but not from the scatterplot.
(c)
Answer to Problem 10E
It is uni-modal and also it is symmetric.
Explanation of Solution
The one fact that is obvious from the histogram but not from the scatterplot is that, we can say that it is uni-modal and also it is symmetric because we can see from the histogram that the left and the right side are almost equal in shape. You can easily see the average with the help of histogram. Thus, it is the benefit of the histogram over scatterplot.
Chapter 7 Solutions
Stats: Modeling the World Nasta Edition Grades 9-12
Additional Math Textbook Solutions
Elementary Statistics: Picturing the World (6th Edition)
Elementary Statistics: Picturing the World (7th Edition)
Statistics: The Art and Science of Learning from Data (4th Edition)
 MATLAB: An Introduction with ApplicationsStatisticsISBN:9781119256830Author:Amos GilatPublisher:John Wiley & Sons Inc
 Probability and Statistics for Engineering and th...StatisticsISBN:9781305251809Author:Jay L. DevorePublisher:Cengage Learning
 Statistics for The Behavioral Sciences (MindTap C...StatisticsISBN:9781305504912Author:Frederick J Gravetter, Larry B. WallnauPublisher:Cengage Learning
 Elementary Statistics: Picturing the World (7th E...StatisticsISBN:9780134683416Author:Ron Larson, Betsy FarberPublisher:PEARSON
 The Basic Practice of StatisticsStatisticsISBN:9781319042578Author:David S. Moore, William I. Notz, Michael A. FlignerPublisher:W. H. Freeman
 Introduction to the Practice of StatisticsStatisticsISBN:9781319013387Author:David S. Moore, George P. McCabe, Bruce A. CraigPublisher:W. H. Freeman


