
Concept explainers
Videos
(a)
To create a
(a)
Explanation of Solution
A survey was conducted in United States and ten countries of Western Europe to determine the percentage of teenagers who had used marijuana and other drugs. The scatterplot for the marijuana and the other drugs is as follows:
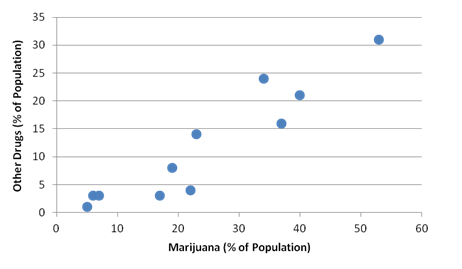
On the horizontal axis there is Marijuana and on the vertical axis there is Other drugs.
(b)
To calculate what is the
(b)
Answer to Problem 34E
The correlation between the marijuana and the other drugs is
Explanation of Solution
A survey was conducted in United States and ten countries of Western Europe to determine the percentage of teenagers who had used marijuana and other drugs.
Then we will calculate the
| Marijuana | Other Drugs |
| 22 | 4 |
| 17 | 3 |
| 40 | 21 |
| 5 | 1 |
| 37 | 16 |
| 19 | 8 |
| 23 | 14 |
| 6 | 3 |
| 7 | 3 |
| 53 | 31 |
| 34 | 24 |
Formula used:
The CORREL
CORREL(array
Calculation:
Now, we will calculate the correlation coefficient using the excel. We will use the above CORREL function for this and we will have,
And the answer to this will be as:
| Correlation coefficient | 0.9341 |
So, the correlation between the marijuana and the other drugsis
(c)
To write a brief description of the association.
(c)
Explanation of Solution
A survey was conducted in United States and ten countries of Western Europe to determine the percentage of teenagers who had used marijuana and other drugs. And the correlation between the marijuana and the other drugs is
Now, we have since the scatterplot has points in an upward direction it seems that the greater the percent of marijuana users, the greater the percent of the other drugs users. As we can see that the relationship is positive and the dots in the scatterplot are moving upwards. And also there is strong relationship between the marijuana and the other drugs as the correlation coefficient is closer to one.
(d)
To explain do these results confirms that marijuana is a “gateway drug”, that is, that marijuana use leads to the use of other drugs or not.
(d)
Answer to Problem 34E
Yes.
Explanation of Solution
A survey was conducted in United States and ten countries of Western Europe to determine the percentage of teenagers who had used marijuana and other drugs.And the correlation between the marijuana and the other drugs is
Yes, these results confirms that marijuana is a “gateway drug”, that is, that marijuana use leads to the use of other drugsbecause there is a strong correlation between Marijuana and other drugs as there correlation coefficient is closer to one.
Chapter 7 Solutions
Stats: Modeling the World Nasta Edition Grades 9-12
Additional Math Textbook Solutions
Basic Business Statistics, Student Value Edition
Statistics for Psychology
An Introduction to Mathematical Statistics and Its Applications (6th Edition)
Elementary Statistics Using Excel (6th Edition)
Statistics: The Art and Science of Learning from Data (4th Edition)
Elementary Statistics: Picturing the World (7th Edition)


 MATLAB: An Introduction with ApplicationsStatisticsISBN:9781119256830Author:Amos GilatPublisher:John Wiley & Sons Inc
 Probability and Statistics for Engineering and th...StatisticsISBN:9781305251809Author:Jay L. DevorePublisher:Cengage Learning
 Statistics for The Behavioral Sciences (MindTap C...StatisticsISBN:9781305504912Author:Frederick J Gravetter, Larry B. WallnauPublisher:Cengage Learning
 Elementary Statistics: Picturing the World (7th E...StatisticsISBN:9780134683416Author:Ron Larson, Betsy FarberPublisher:PEARSON
 The Basic Practice of StatisticsStatisticsISBN:9781319042578Author:David S. Moore, William I. Notz, Michael A. FlignerPublisher:W. H. Freeman
 Introduction to the Practice of StatisticsStatisticsISBN:9781319013387Author:David S. Moore, George P. McCabe, Bruce A. CraigPublisher:W. H. Freeman