
Videos
Previous studies have shown that supplementing the diet with oat bran may lower serum-cholesterol levels. However, it is not known whether the cholesterol is reduced by a direct effect of oat bran or by replacing fatty foods in the diet. To address this question, a study was performed to compare the effect of dietary supplementation with high-fiber oat bran (87 g/day) to dietary supplementation with a low-fiber refined wheat product on the serum cholesterol of 20 healthy participants ages 23-49 years [3]. Each subject had a cholesterol level measured at baseline and then was randomly assigned to receive either a high-fiber or a low-fiber diet for 6 weeks. A 2-week period followed during which no supplements were taken. Participants then took the alternate supplement for a 6-week period. The results are shown in Table 7.7.
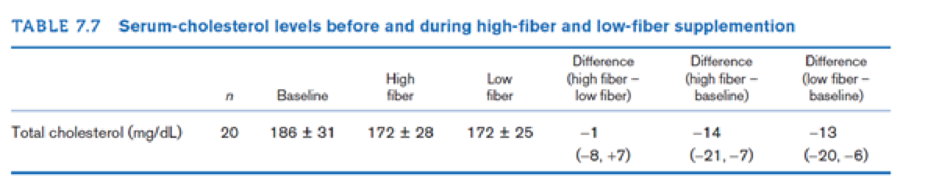
Note: Plus-minus (±) value are
Test the hypothesis that the low-fiber diet has an effect on cholesterol levels as compared with baseline (report your results as p < .05 or p > .05).
Want to see the full answer?
Check out a sample textbook solution
Chapter 7 Solutions
Fundamentals of Biostatistics


- Algal blooms can have negative effects on an ecosystem by dominating its phytoplankton communities. Gonyostomum semen is a nuisance alga infesting many parts of northern Europe. Could the overall biomass of G. semen be controlled by grazing zooplankton species? A research team examined the relationship between the net growth rate of G. semen and the number of Daphnia magna grazers introduced in test tubes. Net growth rate was computed by comparing the initial and final abundance of G. semen in the experiment, with a negative value indicative of a decrease in abundance. The table contains the findings. Number of D. magnagrazers 1 2 3 4 5 6 Net growth rate of G. semen -1.9 -2.5 -2.2 -3.9 -4.1 -4.3 Find the correlation, ?. Use decimal notation. (Enter your answer rounded to three decimal places.)arrow_forwardIs Your Nose Getting Bigger?Next time you see an elderly man, check out his nose and ears! While most parts of the human body stop growing as we reach adulthood, studies show that noses and ears continue to grow larger throughout our lifetime. In one study1 examining noses, researchers report "Age significantly influenced all analyzed measurements:" including volume, surface area, height, and width of noses. In a test to see whether males, on average, have bigger noses than females, the study indicates that "p<0.01."Let group 1 be males and group 2 be females.1Sforza C, Grandi G, De Menezes M, Tartaglia GM, Ferrario VF, "Age- and sex-related changes in the normal human external nose", Forensic Science International, 2011 Jan 30;204(1-3):205.e1-9. (a) State the hypotheses. Your answer should be an expression composed of symbols: =,≠,<,>,μ,μ1,μ2,p,p1,p2,ρ,p^,p^1,p^2,r. H0: vs Ha:Editarrow_forwardIs Your Nose Getting Bigger?Next time you see an elderly man, check out his nose and ears! While most parts of the human body stop growing as we reach adulthood, studies show that noses and ears continue to grow larger throughout our lifetime. In one study1 examining noses, researchers report "Age significantly influenced all analyzed measurements:" including volume, surface area, height, and width of noses. In a test to see whether males, on average, have bigger noses than females, the study indicates that "p<0.01."Let group 1 be males and group 2 be females.(a) State the hypotheses. Your answer should be an expression composed of symbols H0:_ vs Ha:_ (c) Interpret the conclusion in context. -We have evidence that males have bigger noses than females, on average. -We do not have evidence that males have bigger noses than females, on average. -We have evidence that males and females have the same size noses, on average. -We do not have evidence that males and females have the same…arrow_forward
- Bisphenol A in Your Soup CansBisphenol A (BPA) is in the lining of most canned goods, and recent studies have shown a positive association between BPA exposure and behavior and health problems. How much does canned soup consumption increase urinary BPA concentration? That was the question addressed in a recent study1 in which consumption of canned soup over five days was associated with a more than 1000% increase in urinary BPA. In the study, 75 participants ate either canned soup or fresh soup for lunch for five days. On the fifth day, urinary BPA levels were measured. After a two-day break, the participants switched groups and repeated the process. The difference in BPA levels between the two treatments was measured for each participant. The study reports that a 95% confidence interval for the difference in means (canned minus fresh) is 19.6 to 25.5 μg/L. (a) Is this a randomized comparative experiment or a matched pairs experiment? Randomized comparative experiment…arrow_forwardA manufacturer of carpet wanted to reduce the number of flaws per square yard of carpet. Data gathered from quality control measures indicated that Brand A typically had 2.5 flaws per square yard. A mechanical engineer for the company developed a modification of the current process that she thought might reduce the number of flaws. To determine if this was true, one of the machines in the plant was modified according to her specifications. A sample of 30 square yards of carpet was analyzed for flaws. The sample yielded a mean of 2.2 flaws per square yard. Assume the standard deviation of the measurements is 0.66.arrow_forwardA manufacturer of carpet wanted to reduce the number of flaws per square yard of carpet. Data gathered from quality control measures indicated that Brand A typically had 2.5 flaws per square yard. A mechanical engineer for the company developed a modification of the current process that she thought might reduce the number of flaws. To determine if this was true, one of the machines in the plant was modified according to her specifications. A sample of 30 square yards of carpet was analyzed for flaws. The sample yielded a mean of 2.2 flaws per square yard. Assume the standard deviation of the measurements is 0.66. Find the p-value of the test. A) 0.62 B) 0.0124 C)0.9938 D) 0.0062arrow_forward
- Assume we have data demonstrating a strong linear link between the amount of fertilizer applied to certain plants and their yield. Which is the independent variable in this research question?arrow_forwardMy previous classmate researched on the relationship between children’s nutrition and their cognitive development and found out that children have less energy and less interest for learning when under-nutrition. What is the independent, dependent and extraaneous variable?arrow_forwardA researcher hypothesizes that the lowering in cholesterol associated with weight loss is really due to exercise. To test this, the researcher carefully controls for exercise while comparing the cholesterol levels of a group of subjects who lose weight by dieting with a control group that does not diet. The difference between groups in cholesterol is not significant. Can the researcher claim that weight loss has no effect?arrow_forward
- There have been many studies recently concerning coffee drinking and cholesterol level. While it is known that several coffee-bean components can elevate blood cholesterol level, it is thought that a new type of paper coffee filter may reduce the presence of some of these components in coffee. The effect of the new filter on cholesterol level will be studied over a 10-week period using 300 nonsmokers who each drink 4 cups of caffeinated coffee per day. Each of these 300 participants will be assigned to one of two groups: the experimental group, who will only drink coffee that has been made with the new filter, or the control group, who will only drink coffee that has been made with the standard filter. Each participant’s cholesterol level will be measured at the beginning and at the end of the study. Which test would you conduct to determine whether the change in cholesterol level would be greater if people used the new filter rather than using the standard filter? Why would the…arrow_forwardThere have been many studies recently concerning coffee drinking and cholesterol level. While it is known that several coffee-bean components can elevate blood cholesterol level, it is thought that a new type of paper coffee filter may reduce the presence of some of these components in coffee. The effect of the new filter on cholesterol level will be studied over a 10-week period using 300 nonsmokers who each drink 4 cups of caffeinated coffee per day. Each of these 300 participants will be assigned to one of two groups: the experimental group, who will only drink coffee that has been made with the new filter, or the control group, who will only drink coffee that has been made with the standard filter. Each participant’s cholesterol level will be measured at the beginning and at the end of the study. Describe an appropriate method for assigning the subjects to the two groups so that each group will have an equal number of subjects. In this study, the researchers chose to include a…arrow_forwardIron is an integral part of many proteins and enzymes that maintain good health. Recommendations for iron were developed by an institute of medicine for a certain region. The recommended dietary allowance (RDA) of iron for adult females under the age of 51 years is 17.5 milligrams (mg) per day. A hypothesis test is to be performed to decide whether adult females under the age of 51 years are, on average, getting more than the RDA of 17.5 mg of iron per day. Complete parts (a) through (c). a. Determine the null hypothesis. Ho: H mg (Type an integer or a decimal. Do not round.)arrow_forward
 MATLAB: An Introduction with ApplicationsStatisticsISBN:9781119256830Author:Amos GilatPublisher:John Wiley & Sons Inc
 Probability and Statistics for Engineering and th...StatisticsISBN:9781305251809Author:Jay L. DevorePublisher:Cengage Learning
 Statistics for The Behavioral Sciences (MindTap C...StatisticsISBN:9781305504912Author:Frederick J Gravetter, Larry B. WallnauPublisher:Cengage Learning
 Elementary Statistics: Picturing the World (7th E...StatisticsISBN:9780134683416Author:Ron Larson, Betsy FarberPublisher:PEARSON
 The Basic Practice of StatisticsStatisticsISBN:9781319042578Author:David S. Moore, William I. Notz, Michael A. FlignerPublisher:W. H. Freeman
 Introduction to the Practice of StatisticsStatisticsISBN:9781319013387Author:David S. Moore, George P. McCabe, Bruce A. CraigPublisher:W. H. Freeman