Introductory Statistics (10th Edition)
10th Edition
ISBN: 9780321989178
Author: Neil A. Weiss
Publisher: PEARSON
expand_more
expand_more
format_list_bulleted
Concept explainers
Textbook Question
Chapter 6.4, Problem 138E
Finger Length of Criminals. In 1902, W. R. Macdonell published the article “On Criminal Anthropometry and the Identification of Criminals” (Biometrika, Vol. 1, pp. 177–227). Among other things, the author presented data on the left middle finger length, in centimeters. The following table provides the midpoints and frequencies of the finger-length classes used.
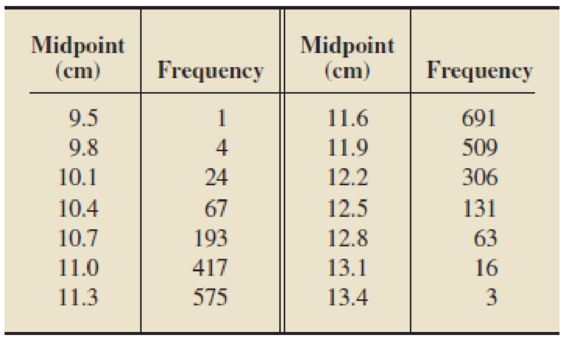
Use these data and the technology of your choice to assess the normality of middle finger length of criminals by using
- a. a histogram.
- b. a normal
probability plot.
Expert Solution & Answer
Want to see the full answer?
Check out a sample textbook solutionStudents have asked these similar questions
This question is from data structures and alghorithms.
The geoemetric mean of 2, 4 & 8.
I.
The data related to the number of cars sold in different dealers in the United States in a
week (sample) are presented below. Round the final results to two decimal places when
necessary.
175
212
179
191
141
226
123
320
191
314
324
192
135
195
216
232
299
171
Calculate:|
L0) Make box plot
1) What conclusions can you reach regarding the sale of cars?
Chapter 6 Solutions
Introductory Statistics (10th Edition)
Ch. 6.1 - What is a density curve?Ch. 6.1 - State the two basic properties of every density...Ch. 6.1 - For a variable with a density curve, what is the...Ch. 6.1 - In each of Exercises 6.46.11, assume that the...Ch. 6.1 - In each of Exercises 6.46.11, assume that the...Ch. 6.1 - In each of Exercises 6.46.11, assume that the...Ch. 6.1 - In each of Exercises 6.46.11, assume that the...Ch. 6.1 - In each of Exercises 6.46.11, assume that the...Ch. 6.1 - In each of Exercises 6.46.11, assume that the...Ch. 6.1 - In each of Exercises 6.46.11, assume that the...
Ch. 6.1 - In each of Exercises 6.46.11, assume that the...Ch. 6.1 - A curve has area 0.425 to the left of 4 and area...Ch. 6.1 - A curve has area 0.613 to the left of 65 and area...Ch. 6.1 - Prob. 14ECh. 6.1 - A variable is approximately normally distributed....Ch. 6.1 - Precisely what is meant by the statement that a...Ch. 6.1 - Two normally distributed variables have the same...Ch. 6.1 - Which normal distribution has a wider spread: the...Ch. 6.1 - Consider two normal distributions, one with mean 4...Ch. 6.1 - Prob. 20ECh. 6.1 - True or false: The mean of a normal distribution...Ch. 6.1 - Prob. 22ECh. 6.1 - Sketch the normal distribution with a. = 3 and =...Ch. 6.1 - Prob. 24ECh. 6.1 - For a normally distributed variable, what is the...Ch. 6.1 - Prob. 26ECh. 6.1 - Prob. 27ECh. 6.1 - The area under a particular normal curve between...Ch. 6.1 - A variable has the density curve whose equation is...Ch. 6.1 - A variable has the density curve whose equation is...Ch. 6.1 - Waiting for the Train. A commuter train arrives...Ch. 6.1 - Bacteria on a Petri Dish. A petri dish is a small,...Ch. 6.1 - Fire Loss. The loss, in millions of dollars, due...Ch. 6.1 - Emergency Room Traffic. Desert Samaritan Hospital...Ch. 6.1 - Female College Students. Refer to Example 6.3 on...Ch. 6.1 - Female College Students. Refer to Example 6.3 on...Ch. 6.1 - Giant Tarantulas. One of the larger species of...Ch. 6.1 - Serum Cholesterol Levels. According to the...Ch. 6.1 - New York City 10-km Run. As reported in Runners...Ch. 6.1 - Prob. 40ECh. 6.1 - Ages of Mothers. From the document National Vital...Ch. 6.1 - Prob. 42ECh. 6.1 - Cloudiness in Breslau. In the paper Cloudiness:...Ch. 6.1 - Prob. 44ECh. 6.1 - Prob. 45ECh. 6.1 - Prob. 46ECh. 6.1 - Chips Ahoy! 1,000 Chips Challenge. Students in an...Ch. 6.1 - Gestation Periods of Humans. Refer to the...Ch. 6.1 - Delaying Adulthood. In the paper, Delayed...Ch. 6.2 - With which normal distribution is the standard...Ch. 6.2 - Without consulting Table II, explain why the area...Ch. 6.2 - Prob. 52ECh. 6.2 - Prob. 53ECh. 6.2 - Prob. 54ECh. 6.2 - Prob. 55ECh. 6.2 - Prob. 56ECh. 6.2 - Prob. 57ECh. 6.2 - Prob. 58ECh. 6.2 - Use Table II to obtain the areas under the...Ch. 6.2 - Use Table II to obtain the areas under the...Ch. 6.2 - Use Table II to obtain the areas under the...Ch. 6.2 - Use Table II to obtain the areas under the...Ch. 6.2 - Use Table II to obtain the areas under the...Ch. 6.2 - Use Table II to obtain the areas under the...Ch. 6.2 - Use Table II to obtain the areas under the...Ch. 6.2 - Use Table II to obtain the areas under the...Ch. 6.2 - Use Table II to obtain each shaded area under the...Ch. 6.2 - Use Table II to obtain each shaded area under the...Ch. 6.2 - In each part, find the area under the standard...Ch. 6.2 - The total area under the following standard normal...Ch. 6.2 - In Exercises 6.716.82, use Table II to obtain the...Ch. 6.2 - In Exercises 6.716.82, use Table II to obtain the...Ch. 6.2 - In Exercises 6.716.82, use Table II to obtain the...Ch. 6.2 - Prob. 74ECh. 6.2 - In Exercises 6.716.82, use Table II to obtain the...Ch. 6.2 - In Exercises 6.716.82, use Table II to obtain the...Ch. 6.2 - Prob. 77ECh. 6.2 - In Exercises 6.716.82, use Table II to obtain the...Ch. 6.2 - Prob. 79ECh. 6.2 - Prob. 80ECh. 6.2 - In Exercises 6.716.82, use Table II to obtain the...Ch. 6.2 - In Exercises 6.716.82, use Table II to obtain the...Ch. 6.2 - Complete the following table.Ch. 6.2 - Prob. 84ECh. 6.2 - Prob. 85ECh. 6.3 - Briefly, for a normally distributed variable, how...Ch. 6.3 - Explain why the percentage of all possible...Ch. 6.3 - Prob. 88ECh. 6.3 - Prob. 89ECh. 6.3 - A variable is normally distributed with mean 68...Ch. 6.3 - A variable is normally distributed with mean 10...Ch. 6.3 - Prob. 92ECh. 6.3 - A variable is normally distributed with mean 6 and...Ch. 6.3 - A variable is normally distributed with mean 68...Ch. 6.3 - A variable is normally distributed with mean 10...Ch. 6.3 - A variable is normally distributed with mean 0 and...Ch. 6.3 - Giant Tarantulas. One of the larger species of...Ch. 6.3 - Serum Cholesterol Levels. According to the...Ch. 6.3 - New York City 10-km Run. As reported in Runners...Ch. 6.3 - Green Sea Urchins. From the paper Effects of...Ch. 6.3 - Arterial Cord pH. Umbilical cord blood analysis...Ch. 6.3 - Elephant Pregnancies. G. Wittemeyer et al. studied...Ch. 6.3 - Gibbon Song Duration. A preliminary behavioral...Ch. 6.3 - Friendship Motivation. In the article Assessing...Ch. 6.3 - Brain Weights. In 1905, R. Pearl published the...Ch. 6.3 - Children Watching TV. The A. C. Nielsen Company...Ch. 6.3 - Heights of Female Students. Refer to Example 6.3...Ch. 6.3 - Womens Shoes. Research reveals that foot length of...Ch. 6.3 - College-Math Success. Researchers S. Lesik and M....Ch. 6.3 - Tipping. In the article Are Christian/Religious...Ch. 6.3 - Booted Eagles. The rare booted eagle of western...Ch. 6.3 - Emergency Room Traffic. Desert Samaritan Hospital...Ch. 6.3 - Let 0 1. For a normally distributed variable,...Ch. 6.3 - Express the quartiles, Q1, Q2, and Q3, of a...Ch. 6.3 - Express the kth percentile, Pk , of a normally...Ch. 6.4 - Under what circumstances is using a normal...Ch. 6.4 - Explain why assessing the normality of a variable...Ch. 6.4 - Explain in detail what a normal probability plot...Ch. 6.4 - How is a normal probability plot used to detect...Ch. 6.4 - Explain how to obtain normal scores from Table III...Ch. 6.4 - In each of Exercises 6.1216.126, we have provided...Ch. 6.4 - In each of Exercises 6.1216.126, we have provided...Ch. 6.4 - In each of Exercises 6.1216.126, we have provided...Ch. 6.4 - In each of Exercises 6.1216.126, we have provided...Ch. 6.4 - In each of Exercises 6.1216.126, we have provided...Ch. 6.4 - Prob. 126ECh. 6.4 - In Exercises 6.1276.130, a. use Table III in...Ch. 6.4 - Prob. 128ECh. 6.4 - In Exercises 6.1276.130, a. use Table III in...Ch. 6.4 - In Exercises 6.1276.130, a. use Table III in...Ch. 6.4 - Prob. 131ECh. 6.4 - In Exercises 6.1316.134, a. obtain a normal...Ch. 6.4 - Prob. 133ECh. 6.4 - Prob. 134ECh. 6.4 - Body Temperature. A study by researchers at the...Ch. 6.4 - Vegetarians and Omnivores. Philosophical and...Ch. 6.4 - Prob. 137ECh. 6.4 - Finger Length of Criminals. In 1902, W. R....Ch. 6.4 - Prob. 139ECh. 6.4 - Emergency Room Traffic. Desert Samaritan Hospital...Ch. 6.5 - Why should you sometimes use normal-curve areas to...Ch. 6.5 - The rule of thumb for using the normal...Ch. 6.5 - In Exercises 6.1436.160, X denotes a binomial...Ch. 6.5 - In Exercises 6.1436.160, X denotes a binomial...Ch. 6.5 - In Exercises 6.1436.160, X denotes a binomial...Ch. 6.5 - In Exercises 6.1436.160, X denotes a binomial...Ch. 6.5 - In Exercises 6.1436.160, X denotes a binomial...Ch. 6.5 - In Exercises 6.1436.160, X denotes a binomial...Ch. 6.5 - In Exercises 6.1436.160, X denotes a binomial...Ch. 6.5 - In Exercises 6.1436.160, X denotes a binomial...Ch. 6.5 - In Exercises 6.1436.160, X denotes a binomial...Ch. 6.5 - In Exercises 6.1436.160, X denotes a binomial...Ch. 6.5 - In Exercises 6.1436.160, X denotes a binomial...Ch. 6.5 - In Exercises 6.1436.160, X denotes a binomial...Ch. 6.5 - In Exercises 6.1436.160, X denotes a binomial...Ch. 6.5 - In Exercises 6.1436.160, X denotes a binomial...Ch. 6.5 - Prob. 157ECh. 6.5 - Prob. 158ECh. 6.5 - In Exercises 6.1436.160, X denotes a binomial...Ch. 6.5 - In Exercises 6.1436.160, X denotes a binomial...Ch. 6.5 - TrueFalse Exams. Refer to Example 6.20 on page...Ch. 6.5 - Prob. 162ECh. 6.5 - TrueFalse Exams. If, in Example 6.20, the...Ch. 6.5 - TrueFalse Exams. If, in Example 6.20, the...Ch. 6.5 - Applying the Concepts and Skills In Exercises...Ch. 6.5 - In Exercises 6.1656.172, apply Procedure 6.3 on...Ch. 6.5 - In Exercises 6.1656.172, apply Procedure 6.3 on...Ch. 6.5 - In Exercises 6.1656.172, apply Procedure 6.3 on...Ch. 6.5 - In Exercises 6.1656.172, apply Procedure 6.3 on...Ch. 6.5 - In Exercises 6.1656.172, apply Procedure 6.3 on...Ch. 6.5 - In Exercises 6.1656.172, apply Procedure 6.3 on...Ch. 6.5 - Prob. 172ECh. 6.5 - Roulette. An American roulette wheel consists of...Ch. 6.5 - Flashlight Battery Lifetimes. A brand of...Ch. 6.5 - Prob. 175ECh. 6 - What is a density curve, and why are such curves...Ch. 6 - In each of Problems 24, assume that the variable...Ch. 6 - In each of Problems 24, assume that the variable...Ch. 6 - In each of Problems 24, assume that the variable...Ch. 6 - Prob. 5RPCh. 6 - State two of the main reasons for studying the...Ch. 6 - Prob. 7RPCh. 6 - Answer true or false to each statement. Give...Ch. 6 - Explain the relationship between percentages for a...Ch. 6 - Prob. 10RPCh. 6 - Prob. 11RPCh. 6 - Prob. 12RPCh. 6 - What key fact permits you to determine percentages...Ch. 6 - Prob. 14RPCh. 6 - Prob. 15RPCh. 6 - Prob. 16RPCh. 6 - State the empirical rule for variables.Ch. 6 - Prob. 18RPCh. 6 - Prob. 19RPCh. 6 - Prob. 20RPCh. 6 - Prob. 21RPCh. 6 - Prob. 22RPCh. 6 - For the standard normal curve, find the z-score(s)...Ch. 6 - Dispensing Coffee. A coffee machine is supposed to...Ch. 6 - Forearm Length. In 1903, K. Pearson and A. Lee...Ch. 6 - Birth Weights. The WONDER database, maintained by...Ch. 6 - Lower Limb Surgery. The study Intrathecal...Ch. 6 - Verbal GRE Scores. The Graduate Record Examination...Ch. 6 - Verbal GRE Scores. Refer to Problem 28, and fill...Ch. 6 - Prob. 30RPCh. 6 - Prob. 31RPCh. 6 - Diarrhea Vaccine. Acute rotavirus diarrhea is the...Ch. 6 - FOCUSING ON DATA ANALYSIS UWEC UNDERGRADUATES...Ch. 6 - CASE STUDY DISCUSSION CHEST SIZES OF SCOTTISH...
Additional Math Textbook Solutions
Find more solutions based on key concepts
Four different beverages are sold at a fast-food restaurant: soft drinks, tea, coffee, and bottled water. a. Ex...
Basic Business Statistics, Student Value Edition
Empirical versus Theoretical A Monopoly player claims that the probability of getting a 4 when rolling a six-si...
Introductory Statistics (2nd Edition)
A father rates his daughter as a 2 on a 7-point scale (from 1 to 7) of crankiness. In this example, (a) what is...
Statistics for Psychology
The data in Table 1A were collected from one of the authors’ statistics classes. The first row gives the variab...
Introductory Statistics
the proportion of red cars in the sample and display the sampling distribution of the sample proportion on dot ...
PRACTICE OF STATISTICS F/AP EXAM
31. Putting It Together: A Tornado Model Is the width of a tornado related to the amount of distance for which ...
Statistics: Informed Decisions Using Data (5th Edition)
Knowledge Booster
Learn more about
Need a deep-dive on the concept behind this application? Look no further. Learn more about this topic, statistics and related others by exploring similar questions and additional content below.Similar questions
- A study was done of 6 patients admitted to a hospital. Their ages (x) and systolic blood pressure (y) was recorded. Systolic blood pressure (y) Age (x) 43 123 48 125 56 135 61 143 67 145 70 152arrow_forwardQuestions 6–10 refer to the sample data in the following table, which describes the fate of the passengers and crew aboard the Titanic when it sank on April 15, 1912. Assume that the data are a sample from a large population and we want to use a 0.05 significance level to test the claim that surviving is independent of whether the person is a man, woman, boy, or girl. Find the number of degrees of freedom.arrow_forwardFrom the data given below, calculate Karl Pearson's and Bowley's coefficients of skewness. Mean = 150, Median = 142, Q, = 62, Q3 = 195, D, = 30, D, = 230, S.D. = 30arrow_forward
- 3.2) Tabulation & Display of Quantitative Data1. Tabulation – Constr. a frequency Distr. TableQuestion 1 : Use the data provided in Q.3 of Section 3 to constr. a freq. distr. Table1. The following data are marks of students in an examination.24 61 36 81 45 37 78 65 60 3947 51 35 82 63 60 58 37 52 2490 87 18 8 29 46 35 64 27 50a. Construct a frequency distribution for the data.b. Compile the cumulative frequency table and draw the cumulative frequency curve.c. If the minimum for grade A was fixed at 74, estimate from your curve the percentage of candidates obtaining grade A.HINTS : Step 1 : Determine the Range, R = HDV – LDVStep 2 : Determine the number of Classes, KK = 1 + 3.3 log NStep 3 : Determine the Width, W for the classesarrow_forwardSleep apnea is a disorder in which you have one or more pauses in breathing or shallow breaths while you sleep. In a cross-sectional study of 390 adults who suffer from sleep apnea, it was found that 273 had gum disease. Note: In the general population, about 17.5% of individuals have gum disease. Complete parts (a) through (c) below. Click here to view the standard normal distribution table (page 1). Click here to view the standard normal distribution table (page 2). Click here to view the table of critical t-values. 4 (a) What does it mean for this study to be cross-sectional?arrow_forwardA sample of blood pressure measurements is taken from a data set and those values (mm Hg) are listed below. The values are matched so that subjects each have systolic and diastolic measurements. Find the mean and median for each of the two samples and then compare the two sets of results. Are the measures of center the best statistics to use with these data? What else might be better? Systolic: 122 137 158 114 156 143 99 112 115 152 Diastolic: 61 51 76 73 55 58 74 60 87 59 Find the means. The mean for systolic is mm Hg and the mean for diastolic is mm Hg. (Type integers or decimals rounded to one decimal place as needed.) ***arrow_forward
- a. Which data set has a larger variation? (justify your answer)b. Is Chebyshev' rule verified for these two data sets. (Justify your answer graphically).c. What can we conclude?arrow_forwardb) The amount of money earned in a day by Ms. Anne’s craft shop was recorded and displayed in the stem-and-leaf diagram shown below in Exhibit 1. Exhibit 1 Stem-and-leaf of Data: Amount of Money earned in a day in dollars Leaf Unit = 10 N = * 2 2 59 5 3 234 13 3 55779999 (**) 4 0001233 14 4 5569 *** 5 03344 5 5 7788 1 6 1 Use the stem-and-leaf diagram above to draw a box-and-whisker diagram.arrow_forward8. Formulating directional and nondirectional hypotheses The body mass index (BMI) of a person is the person’s weight divided by the square of his or her height. It is an indirect measure of the person’s body fat and an indicator of obesity. Results from surveys conducted by the Centers for Disease Control and Prevention (CDC) showed that the estimated mean BMI for US adults increased from 25.0 in the 1960–1962 period to 28.1 in the 1999–2002 period. [Source: Ogden, C., et al. (2004). Mean body weight, height, and body mass index, United States 1960–2002. Advance Data from Vital and Health Statistics, No. 347.] Suppose you are a health researcher. You conduct a hypothesis test to determine whether the mean BMI of US adults in the current year is lower than the mean BMI of US adults in 2000. Assume that the mean BMI of US adults in 2000 was 28.1 (the population mean). You obtain a sample of BMI measurements of 1,034 US adults, which yields a sample mean of M = 28.9. Let μ denote…arrow_forward
- Please also determine a box plot for the men’s data. Question 4arrow_forwarda. Compute the incidence rate of coronary artery disease in patients receiving the new cholesterol medication. b. Compute the incidence rate of coronary artery disease in patients receiving a placebo. attached is the image of the data for this problemarrow_forwardA sample of blood pressure measurements is taken from a data set and those values (mm Hg) are listed below. The values are matched so that subjects each have systolic and diastolic measurements. Find the mean and median for each of the two samples and then compare the two sets of results. Are the measures of center the best statistics to use with these data? What else might be better? Systolic: 97 96 134 112 154 116 156 99 153 117 Diastolic: 63 55 87 73 76 88 85 79 69 62 Find the means. The mean for systolic is nothing mm Hg and the mean for diastolic is nothing mm Hg. (Type integers or decimals rounded to one decimal place as needed.) Find the medians. The median for systolic is nothing mm Hg and the median for diastolic is nothing mm Hg. (Type integers or decimals rounded to one decimal place as needed.) Compare the results. Choose the correct answer below. A. The median is lower for the…arrow_forward
arrow_back_ios
SEE MORE QUESTIONS
arrow_forward_ios
Recommended textbooks for you
- MATLAB: An Introduction with ApplicationsStatisticsISBN:9781119256830Author:Amos GilatPublisher:John Wiley & Sons IncProbability and Statistics for Engineering and th...StatisticsISBN:9781305251809Author:Jay L. DevorePublisher:Cengage LearningStatistics for The Behavioral Sciences (MindTap C...StatisticsISBN:9781305504912Author:Frederick J Gravetter, Larry B. WallnauPublisher:Cengage Learning
- Elementary Statistics: Picturing the World (7th E...StatisticsISBN:9780134683416Author:Ron Larson, Betsy FarberPublisher:PEARSONThe Basic Practice of StatisticsStatisticsISBN:9781319042578Author:David S. Moore, William I. Notz, Michael A. FlignerPublisher:W. H. FreemanIntroduction to the Practice of StatisticsStatisticsISBN:9781319013387Author:David S. Moore, George P. McCabe, Bruce A. CraigPublisher:W. H. Freeman
MATLAB: An Introduction with Applications
Statistics
ISBN:9781119256830
Author:Amos Gilat
Publisher:John Wiley & Sons Inc
Probability and Statistics for Engineering and th...
Statistics
ISBN:9781305251809
Author:Jay L. Devore
Publisher:Cengage Learning
Statistics for The Behavioral Sciences (MindTap C...
Statistics
ISBN:9781305504912
Author:Frederick J Gravetter, Larry B. Wallnau
Publisher:Cengage Learning
Elementary Statistics: Picturing the World (7th E...
Statistics
ISBN:9780134683416
Author:Ron Larson, Betsy Farber
Publisher:PEARSON
The Basic Practice of Statistics
Statistics
ISBN:9781319042578
Author:David S. Moore, William I. Notz, Michael A. Fligner
Publisher:W. H. Freeman
Introduction to the Practice of Statistics
Statistics
ISBN:9781319013387
Author:David S. Moore, George P. McCabe, Bruce A. Craig
Publisher:W. H. Freeman
Finding Local Maxima and Minima by Differentiation; Author: Professor Dave Explains;https://www.youtube.com/watch?v=pvLj1s7SOtk;License: Standard YouTube License, CC-BY