
Introductory Statistics (10th Edition)
10th Edition
ISBN: 9780321989178
Author: Neil A. Weiss
Publisher: PEARSON
expand_more
expand_more
format_list_bulleted
Concept explainers
Videos
Textbook Question
Chapter 6.4, Problem 122E
In each of Exercises 6.121–6.126, we have provided a normal
6.122 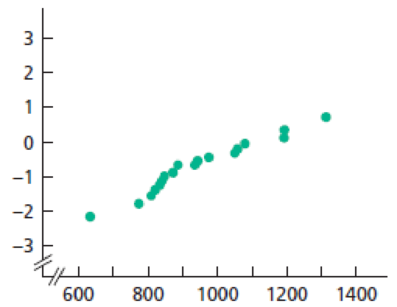
Expert Solution & Answer
Want to see the full answer?
Check out a sample textbook solution
Students have asked these similar questions
A researcher believes that the so-called “sugar high” is not real. He gathered 30 adolescents and recorded their activity level in the scale of 0 – 100 (0 = not active and 100 = super active). First, he recorded participants’ activity level before they consumed candy. After recording their pre-sugar activity level, the researcher gave out 5 Snickers bars to participants. Then, he recorded their post-sugar activity level. The average difference between post-sugar and pre-sugar activity level is 50 (i.e., the activity levels are higher after sugar than prior to it) with a standard deviation of 10.
A). Complete test statistic and critical values
B). Conclusion
A researcher believes that the so-called “sugar high” is not real. He gathered 30 adolescents and recorded their activity level in the scale of 0 – 100 (0 = not active and 100 = super active). First, he recorded participants’ activity level before they consumed candy. After recording their pre-sugar activity level, the researcher gave out 5 Snickers bars to participants. Then, he recorded their post-sugar activity level. The average difference between post-sugar and pre-sugar activity level is 50 (i.e., the activity levels are higher after sugar than prior to it) with a standard deviation of 10.
A). What is the type of test you will use? (z-test, single-sample t-test, paired-samples t-test, or independent samples t-test) and why (what information provided in the problem)B). What are the hypotheses (Be Specific)
In Exercises 1–3, use the data listed below. The values are departure delay times (minutes) for American Airlines flights from New York to Los Angeles. Negative values correspond to flights that departed early.
Test for Normality Use the departure delay times for Flight 19 and test for normality using a normal quantile plot.
Chapter 6 Solutions
Introductory Statistics (10th Edition)
Ch. 6.1 - What is a density curve?Ch. 6.1 - State the two basic properties of every density...Ch. 6.1 - For a variable with a density curve, what is the...Ch. 6.1 - In each of Exercises 6.46.11, assume that the...Ch. 6.1 - In each of Exercises 6.46.11, assume that the...Ch. 6.1 - In each of Exercises 6.46.11, assume that the...Ch. 6.1 - In each of Exercises 6.46.11, assume that the...Ch. 6.1 - In each of Exercises 6.46.11, assume that the...Ch. 6.1 - In each of Exercises 6.46.11, assume that the...Ch. 6.1 - In each of Exercises 6.46.11, assume that the...
Ch. 6.1 - In each of Exercises 6.46.11, assume that the...Ch. 6.1 - A curve has area 0.425 to the left of 4 and area...Ch. 6.1 - A curve has area 0.613 to the left of 65 and area...Ch. 6.1 - Prob. 14ECh. 6.1 - A variable is approximately normally distributed....Ch. 6.1 - Precisely what is meant by the statement that a...Ch. 6.1 - Two normally distributed variables have the same...Ch. 6.1 - Which normal distribution has a wider spread: the...Ch. 6.1 - Consider two normal distributions, one with mean 4...Ch. 6.1 - Prob. 20ECh. 6.1 - True or false: The mean of a normal distribution...Ch. 6.1 - Prob. 22ECh. 6.1 - Sketch the normal distribution with a. = 3 and =...Ch. 6.1 - Prob. 24ECh. 6.1 - For a normally distributed variable, what is the...Ch. 6.1 - Prob. 26ECh. 6.1 - Prob. 27ECh. 6.1 - The area under a particular normal curve between...Ch. 6.1 - A variable has the density curve whose equation is...Ch. 6.1 - A variable has the density curve whose equation is...Ch. 6.1 - Waiting for the Train. A commuter train arrives...Ch. 6.1 - Bacteria on a Petri Dish. A petri dish is a small,...Ch. 6.1 - Fire Loss. The loss, in millions of dollars, due...Ch. 6.1 - Emergency Room Traffic. Desert Samaritan Hospital...Ch. 6.1 - Female College Students. Refer to Example 6.3 on...Ch. 6.1 - Female College Students. Refer to Example 6.3 on...Ch. 6.1 - Giant Tarantulas. One of the larger species of...Ch. 6.1 - Serum Cholesterol Levels. According to the...Ch. 6.1 - New York City 10-km Run. As reported in Runners...Ch. 6.1 - Prob. 40ECh. 6.1 - Ages of Mothers. From the document National Vital...Ch. 6.1 - Prob. 42ECh. 6.1 - Cloudiness in Breslau. In the paper Cloudiness:...Ch. 6.1 - Prob. 44ECh. 6.1 - Prob. 45ECh. 6.1 - Prob. 46ECh. 6.1 - Chips Ahoy! 1,000 Chips Challenge. Students in an...Ch. 6.1 - Gestation Periods of Humans. Refer to the...Ch. 6.1 - Delaying Adulthood. In the paper, Delayed...Ch. 6.2 - With which normal distribution is the standard...Ch. 6.2 - Without consulting Table II, explain why the area...Ch. 6.2 - Prob. 52ECh. 6.2 - Prob. 53ECh. 6.2 - Prob. 54ECh. 6.2 - Prob. 55ECh. 6.2 - Prob. 56ECh. 6.2 - Prob. 57ECh. 6.2 - Prob. 58ECh. 6.2 - Use Table II to obtain the areas under the...Ch. 6.2 - Use Table II to obtain the areas under the...Ch. 6.2 - Use Table II to obtain the areas under the...Ch. 6.2 - Use Table II to obtain the areas under the...Ch. 6.2 - Use Table II to obtain the areas under the...Ch. 6.2 - Use Table II to obtain the areas under the...Ch. 6.2 - Use Table II to obtain the areas under the...Ch. 6.2 - Use Table II to obtain the areas under the...Ch. 6.2 - Use Table II to obtain each shaded area under the...Ch. 6.2 - Use Table II to obtain each shaded area under the...Ch. 6.2 - In each part, find the area under the standard...Ch. 6.2 - The total area under the following standard normal...Ch. 6.2 - In Exercises 6.716.82, use Table II to obtain the...Ch. 6.2 - In Exercises 6.716.82, use Table II to obtain the...Ch. 6.2 - In Exercises 6.716.82, use Table II to obtain the...Ch. 6.2 - Prob. 74ECh. 6.2 - In Exercises 6.716.82, use Table II to obtain the...Ch. 6.2 - In Exercises 6.716.82, use Table II to obtain the...Ch. 6.2 - Prob. 77ECh. 6.2 - In Exercises 6.716.82, use Table II to obtain the...Ch. 6.2 - Prob. 79ECh. 6.2 - Prob. 80ECh. 6.2 - In Exercises 6.716.82, use Table II to obtain the...Ch. 6.2 - In Exercises 6.716.82, use Table II to obtain the...Ch. 6.2 - Complete the following table.Ch. 6.2 - Prob. 84ECh. 6.2 - Prob. 85ECh. 6.3 - Briefly, for a normally distributed variable, how...Ch. 6.3 - Explain why the percentage of all possible...Ch. 6.3 - Prob. 88ECh. 6.3 - Prob. 89ECh. 6.3 - A variable is normally distributed with mean 68...Ch. 6.3 - A variable is normally distributed with mean 10...Ch. 6.3 - Prob. 92ECh. 6.3 - A variable is normally distributed with mean 6 and...Ch. 6.3 - A variable is normally distributed with mean 68...Ch. 6.3 - A variable is normally distributed with mean 10...Ch. 6.3 - A variable is normally distributed with mean 0 and...Ch. 6.3 - Giant Tarantulas. One of the larger species of...Ch. 6.3 - Serum Cholesterol Levels. According to the...Ch. 6.3 - New York City 10-km Run. As reported in Runners...Ch. 6.3 - Green Sea Urchins. From the paper Effects of...Ch. 6.3 - Arterial Cord pH. Umbilical cord blood analysis...Ch. 6.3 - Elephant Pregnancies. G. Wittemeyer et al. studied...Ch. 6.3 - Gibbon Song Duration. A preliminary behavioral...Ch. 6.3 - Friendship Motivation. In the article Assessing...Ch. 6.3 - Brain Weights. In 1905, R. Pearl published the...Ch. 6.3 - Children Watching TV. The A. C. Nielsen Company...Ch. 6.3 - Heights of Female Students. Refer to Example 6.3...Ch. 6.3 - Womens Shoes. Research reveals that foot length of...Ch. 6.3 - College-Math Success. Researchers S. Lesik and M....Ch. 6.3 - Tipping. In the article Are Christian/Religious...Ch. 6.3 - Booted Eagles. The rare booted eagle of western...Ch. 6.3 - Emergency Room Traffic. Desert Samaritan Hospital...Ch. 6.3 - Let 0 1. For a normally distributed variable,...Ch. 6.3 - Express the quartiles, Q1, Q2, and Q3, of a...Ch. 6.3 - Express the kth percentile, Pk , of a normally...Ch. 6.4 - Under what circumstances is using a normal...Ch. 6.4 - Explain why assessing the normality of a variable...Ch. 6.4 - Explain in detail what a normal probability plot...Ch. 6.4 - How is a normal probability plot used to detect...Ch. 6.4 - Explain how to obtain normal scores from Table III...Ch. 6.4 - In each of Exercises 6.1216.126, we have provided...Ch. 6.4 - In each of Exercises 6.1216.126, we have provided...Ch. 6.4 - In each of Exercises 6.1216.126, we have provided...Ch. 6.4 - In each of Exercises 6.1216.126, we have provided...Ch. 6.4 - In each of Exercises 6.1216.126, we have provided...Ch. 6.4 - Prob. 126ECh. 6.4 - In Exercises 6.1276.130, a. use Table III in...Ch. 6.4 - Prob. 128ECh. 6.4 - In Exercises 6.1276.130, a. use Table III in...Ch. 6.4 - In Exercises 6.1276.130, a. use Table III in...Ch. 6.4 - Prob. 131ECh. 6.4 - In Exercises 6.1316.134, a. obtain a normal...Ch. 6.4 - Prob. 133ECh. 6.4 - Prob. 134ECh. 6.4 - Body Temperature. A study by researchers at the...Ch. 6.4 - Vegetarians and Omnivores. Philosophical and...Ch. 6.4 - Prob. 137ECh. 6.4 - Finger Length of Criminals. In 1902, W. R....Ch. 6.4 - Prob. 139ECh. 6.4 - Emergency Room Traffic. Desert Samaritan Hospital...Ch. 6.5 - Why should you sometimes use normal-curve areas to...Ch. 6.5 - The rule of thumb for using the normal...Ch. 6.5 - In Exercises 6.1436.160, X denotes a binomial...Ch. 6.5 - In Exercises 6.1436.160, X denotes a binomial...Ch. 6.5 - In Exercises 6.1436.160, X denotes a binomial...Ch. 6.5 - In Exercises 6.1436.160, X denotes a binomial...Ch. 6.5 - In Exercises 6.1436.160, X denotes a binomial...Ch. 6.5 - In Exercises 6.1436.160, X denotes a binomial...Ch. 6.5 - In Exercises 6.1436.160, X denotes a binomial...Ch. 6.5 - In Exercises 6.1436.160, X denotes a binomial...Ch. 6.5 - In Exercises 6.1436.160, X denotes a binomial...Ch. 6.5 - In Exercises 6.1436.160, X denotes a binomial...Ch. 6.5 - In Exercises 6.1436.160, X denotes a binomial...Ch. 6.5 - In Exercises 6.1436.160, X denotes a binomial...Ch. 6.5 - In Exercises 6.1436.160, X denotes a binomial...Ch. 6.5 - In Exercises 6.1436.160, X denotes a binomial...Ch. 6.5 - Prob. 157ECh. 6.5 - Prob. 158ECh. 6.5 - In Exercises 6.1436.160, X denotes a binomial...Ch. 6.5 - In Exercises 6.1436.160, X denotes a binomial...Ch. 6.5 - TrueFalse Exams. Refer to Example 6.20 on page...Ch. 6.5 - Prob. 162ECh. 6.5 - TrueFalse Exams. If, in Example 6.20, the...Ch. 6.5 - TrueFalse Exams. If, in Example 6.20, the...Ch. 6.5 - Applying the Concepts and Skills In Exercises...Ch. 6.5 - In Exercises 6.1656.172, apply Procedure 6.3 on...Ch. 6.5 - In Exercises 6.1656.172, apply Procedure 6.3 on...Ch. 6.5 - In Exercises 6.1656.172, apply Procedure 6.3 on...Ch. 6.5 - In Exercises 6.1656.172, apply Procedure 6.3 on...Ch. 6.5 - In Exercises 6.1656.172, apply Procedure 6.3 on...Ch. 6.5 - In Exercises 6.1656.172, apply Procedure 6.3 on...Ch. 6.5 - Prob. 172ECh. 6.5 - Roulette. An American roulette wheel consists of...Ch. 6.5 - Flashlight Battery Lifetimes. A brand of...Ch. 6.5 - Prob. 175ECh. 6 - What is a density curve, and why are such curves...Ch. 6 - In each of Problems 24, assume that the variable...Ch. 6 - In each of Problems 24, assume that the variable...Ch. 6 - In each of Problems 24, assume that the variable...Ch. 6 - Prob. 5RPCh. 6 - State two of the main reasons for studying the...Ch. 6 - Prob. 7RPCh. 6 - Answer true or false to each statement. Give...Ch. 6 - Explain the relationship between percentages for a...Ch. 6 - Prob. 10RPCh. 6 - Prob. 11RPCh. 6 - Prob. 12RPCh. 6 - What key fact permits you to determine percentages...Ch. 6 - Prob. 14RPCh. 6 - Prob. 15RPCh. 6 - Prob. 16RPCh. 6 - State the empirical rule for variables.Ch. 6 - Prob. 18RPCh. 6 - Prob. 19RPCh. 6 - Prob. 20RPCh. 6 - Prob. 21RPCh. 6 - Prob. 22RPCh. 6 - For the standard normal curve, find the z-score(s)...Ch. 6 - Dispensing Coffee. A coffee machine is supposed to...Ch. 6 - Forearm Length. In 1903, K. Pearson and A. Lee...Ch. 6 - Birth Weights. The WONDER database, maintained by...Ch. 6 - Lower Limb Surgery. The study Intrathecal...Ch. 6 - Verbal GRE Scores. The Graduate Record Examination...Ch. 6 - Verbal GRE Scores. Refer to Problem 28, and fill...Ch. 6 - Prob. 30RPCh. 6 - Prob. 31RPCh. 6 - Diarrhea Vaccine. Acute rotavirus diarrhea is the...Ch. 6 - FOCUSING ON DATA ANALYSIS UWEC UNDERGRADUATES...Ch. 6 - CASE STUDY DISCUSSION CHEST SIZES OF SCOTTISH...
Additional Math Textbook Solutions
Find more solutions based on key concepts
2.18 Graph the relative frequency histogram for the 500 measurements summarized in the accompanying relative fr...
Statistics for Business and Economics (13th Edition)
In Exercises 9-20, use the data in the following table, which lists drive-thru order accuracy at popular fast f...
Elementary Statistics (13th Edition)
31. Putting It Together: A Tornado Model Is the width of a tornado related to the amount of distance for which ...
Statistics: Informed Decisions Using Data (5th Edition)
A father rates his daughter as a 2 on a 7-point scale (from 1 to 7) of crankiness. In this example, (a) what is...
Statistics for Psychology
In Exercises 5-36, express all probabilities as fractions.
23. Combination Lock The typical combination lock us...
Elementary Statistics
Testing Hypotheses. In Exercises 13-24, assume that a simple random sample has been selected and test the given...
Elementary Statistics Using The Ti-83/84 Plus Calculator, Books A La Carte Edition (5th Edition)
Knowledge Booster


Learn more about
Need a deep-dive on the concept behind this application? Look no further. Learn more about this topic, statistics and related others by exploring similar questions and additional content below.Similar questions
- yegATAT COucebr CuocK 2. BOWLING. A bowling handicap is a percentage of the difference between your average and a basis average. Your bowling handicap allows you to compete against other bowlers with varying levels of skill and ability with an equal chance of winning. If you belong to a bowling league in which each bowler's handicap h is determined by his or her average a using this formula: INDOKEBIA 2018 h = 0.9 (200 - a). If the bowler's average is over 200, the handicap is 0. all to riqsig ort be a. Find the inverse of the function. https://www.bworldonline.com/philippines-ends-asian-para-games- bid-at-a-much-improved-11th-place-from-24th/ b. Find your average if your handicap is 27. Solve here: eeri nislo noionut eeevni ha 1ol noilsupe ne pribni ni ed 18arrow_forwardFind the z score for test scores of 70 _____ and 90 ______.arrow_forwardLecture(11.14): A professor offered a course half online and half in person.The professor hypothesized that students were spending less time engaged with course during online than in person,At the end of the semester students were asked to provide the amount of time they tended in a week. The weeks were classified as online or in person and the average amount of time for 15 weeks is given below. Online: 4 3 5 6 2 2 4 7 5 4 3 2 6 6 3 In person: 5 5 4 7 3 4 4 6 4 5 3 4 5 8 4 Test the hypotheses at (alpha= 0.05) level of significance using the 5 step hypotheses testing. Make sure you clesrly state the null and alternative hypotheses. Round your answer to 2 decimal places; person. and the average amount of time spent for 15 studentsarrow_forward
- Suppose that 95% of the bags of certain fertilizer mix weigh between 49 and 53 pounds. Averages of three succesive bags were plotted, and 47.5% of these were observed to lie between 51 and X pounds. Estimate the value of X. State assumptions you make and say whether these assumptions are likely to be true for this example.arrow_forward3.3 Solve the below problem: A manufacturing plant uses a specific bulk product. The amount of product used in one day can be modelled by an exponential distribution with B = 2 (measurements in tons). Find the probability that the plant will use more than 2 tons on a given day. Interpret your answer.arrow_forwardQ3 let X and Y be two sections of STAT290 and the results of MID exam for each section are given in the following table. Test whether the proportion of passing MID exam is greater for section X. MID exam Pass Fail Section X 10 12 Y 2 8arrow_forward
- lecture(12.1): A statistics class is made up of 22 students learning on line and 15 studying in person. What percentage of the class is learning in person?arrow_forwardThe American Mineralogist (Oct. 2009) published a study of the evolution of uranium minerals in the Earth's crust. Researchers estimate that the trace amount of uranium x in reservoirs follows a uniform distribution ranging between 1 and 3 parts per million. Complete parts a through c. a. Find E(x) and interpret its value. Select the correct answer below and fill in the answer box to complete your choice. (Simplify your answer.) O A. E(X)= This value gives the minimum parts per million of uranium for the collection of all reservoirs on the Earth. O B. E(X)= This value gives the maximum parts per million of uranium for the collection of all reservoirs on the Earth. O C. E(x)= This value gives the mean parts per million of uranium for the collection of all reservoirs on the Earth. O D. E(X)= This value gives the mean parts per million of uranium in each reservoir on the Earth.arrow_forward1. 2. 3. Devon is expected to receive 70% of the votes at the student council election. If there are 650 students in his school, how many are expected to vote for him? The probability of being born in a particular month is about 1:12. Determine the probability of not being born in September. Express this ratio as a fraction, a decimal, a percent and in words. In his first hockey game of the season, Brayden takes a total of 10 shots on the goalie and scores 1 time. Later in the season, he takes 30 shots in total on the goalie. How many goals would you expect him to make? What assumptions are making? Are your assumptions realistic? Explain.arrow_forward
- %9. 1. 9:1V A residential building includes 60 apartments for leasing located in two floors: ground and first floors. Ground floor tenants usually pay higher rent than first floor tenants. Building owner receives 2000$ as the mean monthly rent from the tenants. The ground floor and first floor tenants pay 2360$ and 1460$ respectively. Determine the number of apartments in the * .first floor 24 12 28 14 36 20 33 38 11 42arrow_forwardA relationship expert wants to know if people with higher levels of emotional intelligence (measured on an interval scale from 1–6, with higher numbers meaning more intelligence) will be better liked upon first meeting people (measured on a 1–5 interval scale, with higher numbers meaning more likable). X: Emotional Intelligence Score X: First Impression Rating 6 1 2.5 4 M=3.38 s=2.14 SS = 13.69 Y: First Impression Rating 5 1.5 3 3.5 M=3.25 s=1.44 SS = 6.25 a) Create a scatterplot of the data. b) Calculate r and r2 . c) Report results in APA style. d) What do the results mean?arrow_forwardInvestigators are trying to determine if the contamination of a town well led to significant increases in adverse health effects. During the period of time when water was consumed from this contaminated well, there were 16 birth defects among 414 births. After this well was shut off, there were 3 birth defects among 228 births. You asked to determine if the rate of birth defects was higher when the contaminated well was in use. a. Test the claim that the contaminated well was not associated with a change in the rate of birth defects in the community at the alpha = 0.05 level, by using the two-proportion z test. Confirm your answers using Stata. b. Calculate a 95% confidence interval for the true difference between the proportions of birth defects when the contaminated well was in use versus when the well was shut down. c. Construct the 2x2 contingency table representing the data to Calculate the odds of a birth defect when the contaminated water was consumed and when the well was shut…arrow_forward
arrow_back_ios
SEE MORE QUESTIONS
arrow_forward_ios
Recommended textbooks for you
 MATLAB: An Introduction with ApplicationsStatisticsISBN:9781119256830Author:Amos GilatPublisher:John Wiley & Sons Inc
 Probability and Statistics for Engineering and th...StatisticsISBN:9781305251809Author:Jay L. DevorePublisher:Cengage Learning
 Statistics for The Behavioral Sciences (MindTap C...StatisticsISBN:9781305504912Author:Frederick J Gravetter, Larry B. WallnauPublisher:Cengage Learning
 Elementary Statistics: Picturing the World (7th E...StatisticsISBN:9780134683416Author:Ron Larson, Betsy FarberPublisher:PEARSON
 The Basic Practice of StatisticsStatisticsISBN:9781319042578Author:David S. Moore, William I. Notz, Michael A. FlignerPublisher:W. H. Freeman
 Introduction to the Practice of StatisticsStatisticsISBN:9781319013387Author:David S. Moore, George P. McCabe, Bruce A. CraigPublisher:W. H. Freeman
MATLAB: An Introduction with Applications
Statistics
ISBN:9781119256830
Author:Amos Gilat
Publisher:John Wiley & Sons Inc
Probability and Statistics for Engineering and th...
Statistics
ISBN:9781305251809
Author:Jay L. Devore
Publisher:Cengage Learning
Statistics for The Behavioral Sciences (MindTap C...
Statistics
ISBN:9781305504912
Author:Frederick J Gravetter, Larry B. Wallnau
Publisher:Cengage Learning
Elementary Statistics: Picturing the World (7th E...
Statistics
ISBN:9780134683416
Author:Ron Larson, Betsy Farber
Publisher:PEARSON
The Basic Practice of Statistics
Statistics
ISBN:9781319042578
Author:David S. Moore, William I. Notz, Michael A. Fligner
Publisher:W. H. Freeman
Introduction to the Practice of Statistics
Statistics
ISBN:9781319013387
Author:David S. Moore, George P. McCabe, Bruce A. Craig
Publisher:W. H. Freeman
Continuous Probability Distributions - Basic Introduction; Author: The Organic Chemistry Tutor;https://www.youtube.com/watch?v=QxqxdQ_g2uw;License: Standard YouTube License, CC-BY
Probability Density Function (p.d.f.) Finding k (Part 1) | ExamSolutions; Author: ExamSolutions;https://www.youtube.com/watch?v=RsuS2ehsTDM;License: Standard YouTube License, CC-BY
Find the value of k so that the Function is a Probability Density Function; Author: The Math Sorcerer;https://www.youtube.com/watch?v=QqoCZWrVnbA;License: Standard Youtube License