
Fundamentals of Biostatistics
8th Edition
ISBN: 9781305268920
Author: Bernard Rosner
Publisher: Cengage Learning
expand_more
expand_more
format_list_bulleted
Concept explainers
Videos
Textbook Question
Chapter 6, Problem 23P
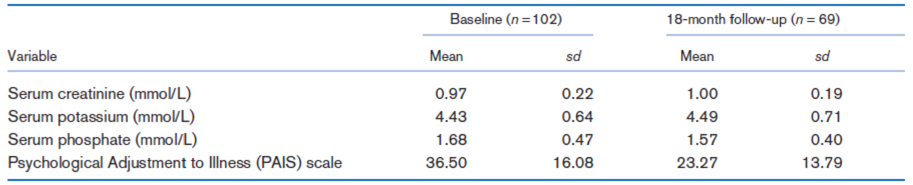
A study of psychological and physiological health in a cohort of dialysis patients with end-stage renal disease was conducted [7]. Psychological and physiological parameters were initially determined at baseline in 102 patients; these parameters were determined again in 69 of the 102 patients at an 18-month follow-up visit. The data in Table 6.12 were reported.
Table 6.12 Psychological and physiological parameters in patients with end-stage renal disease
 Provide a point and
Expert Solution & Answer
Want to see the full answer?
Check out a sample textbook solution
Students have asked these similar questions
In a test of the effectiveness of garlic for lowering cholesterol,
41
senior citizens
were treated with garlic in a processed tablet form. Cholesterol levels were measured before and after the treatment. The changes in their levels of LDL cholesterol (in mg/dL) have an average (mean) of
3.8.
Identify the sample, the population, the sample statistic, and the population parameter in this study.
The 5-year incidence of cardiovascular disease (CVD) in relation to smoking status was determined in a population sample of 1000 men, 18 years and older. At baseline, 30% of the men were classified as being current smokers and 70% as being non-smokers. At the end of the follow-up, 60 CVD events had occurred among the smokers and 70 events among the non-smokers.
Construct a 2 x 2 table based on the data provided
Blood cocaine concentration (mg/L) was determinedboth for a sample of individuals who had died fromcocaine-induced excited delirium (ED) and for a sampleof those who had died from a cocaine overdose withoutexcited delirium; survival time for people in bothgroups was at most 6 hours. The accompanying datawas read from a comparative boxplot in the article“Fatal Excited Delirium Following Cocaine Use” (J.of Forensic Sciences, 1997: 25–31).
ED 0 0 0 0 .1 .1 .1 .1 .2 .2 .3 .3.3 .4 .5 .7 .8 1.0 1.5 2.7 2.83.5 4.0 8.9 9.2 11.7 21.0Non-ED 0 0 0 0 0 .1 .1 .1 .1 .2 .2 .2.3 .3 .3 .4 .5 .5 .6 .8 .9 1.01.2 1.4 1.5 1.7 2.0 3.2 3.5 4.14.3 4.8 5.0 5.6 5.9 6.0 6.4 7.98.3 8.7 9.1 9.6 9.9 11.0 11.512.2 12.7 14.0 16.6 17.8
a. Determine the medians, fourths, and fourth spreadsfor the two samples.b. Are there any outliers in either sample? Any extremeoutliers?c. Construct a comparative boxplot, and use it as abasis for comparing and contrasting the ED andnon-ED samples.
Chapter 6 Solutions
Fundamentals of Biostatistics
Ch. 6.5 - What is the difference between a standard...Ch. 6.5 - What does a 95% CI mean?Ch. 6 - Suppose we are asked to construct a list of...Ch. 6 - Suppose we are asked to construct a list of...Ch. 6 - Suppose we are asked to construct a list of...Ch. 6 - Suppose we are asked to construct a list of...Ch. 6 - The data in Table 6.10 concern the mean triceps...Ch. 6 - The data in Table 6.10 concern the mean triceps...Ch. 6 - The data in Table 6.10 concern the mean triceps...Ch. 6 - The data in Table 6.10 concern the mean triceps...
Ch. 6 - The data in Table 6.10 concern the mean triceps...Ch. 6 - The data in Table 6.10 concern the mean triceps...Ch. 6 - Refer to the data in Table 2.13. Regard this...Ch. 6 - Refer to the data in Table 2.13. Regard this...Ch. 6 - Refer to the data in Table 2.13. Regard this...Ch. 6 - Refer to the data in Table 2.13. Regard this...Ch. 6 - Refer to the data in Table 2.13. Regard this...Ch. 6 - Refer to the data in Table 2.13. Regard this...Ch. 6 - Refer to the data in Table 2.13. Regard this...Ch. 6 - A nine-laboratory cooperative study was performed...Ch. 6 - A nine-laboratory cooperative study was performed...Ch. 6 - A nine-laboratory cooperative study was performed...Ch. 6 - A nine-laboratory cooperative study was performed...Ch. 6 - A nine-laboratory cooperative study was performed...Ch. 6 - A study of psychological and physiological health...Ch. 6 - A study of psychological and physiological health...Ch. 6 - A study is conducted to test the hypothesis that...Ch. 6 - A study is conducted to test the hypothesis that...Ch. 6 - Suppose a clinical trial is conducted to test the...Ch. 6 - Suppose a clinical trial is conducted to test the...Ch. 6 - Suppose a clinical trial is conducted to test the...Ch. 6 - Suppose we want to estimate the concentration...Ch. 6 - Suppose we want to estimate the concentration...Ch. 6 - Suppose we want to estimate the concentration...Ch. 6 - Much discussion has taken place concerning...Ch. 6 - Much discussion has taken place concerning...Ch. 6 - Much discussion has taken place concerning...Ch. 6 - A new assay is developed to obtain the...Ch. 6 - A new assay is developed to obtain the...Ch. 6 - A new assay is developed to obtain the...Ch. 6 - A new assay is developed to obtain the...Ch. 6 - Suppose 100 hypertensive people are given an...Ch. 6 - Suppose 100 hypertensive people are given an...Ch. 6 - Suppose 100 hypertensive people are given an...Ch. 6 - Suppose we decide a better measure of the...Ch. 6 - Suppose we decide a better measure of the...Ch. 6 - Suppose we decide a better measure of the...Ch. 6 - Suppose we decide a better measure of the...Ch. 6 - Draw six random samples of size 5 from the data in...Ch. 6 - Draw six random samples of size 5 from the data in...Ch. 6 - Draw six random samples of size 5 from the data in...Ch. 6 - Draw six random samples of size 5 from the data in...Ch. 6 - Draw six random samples of size 5 from the data in...Ch. 6 - Figure 6.4b (p. 172) plotted the sampling...Ch. 6 - Figure 6.4b (p. 172) plotted the sampling...Ch. 6 - Figure 6.4b (p. 172) plotted the sampling...Ch. 6 - Figure 6.4b (p. 172) plotted the sampling...Ch. 6 - The etiology of high blood pressure remains a...Ch. 6 - The etiology of high blood pressure remains a...Ch. 6 - The etiology of high blood pressure remains a...Ch. 6 - Data Set SEXRAT.DAT, at www.cengagebrain.com,...Ch. 6 - A cohort of hemophiliacs is followed to elicit...Ch. 6 - A cohort of hemophiliacs is followed to elicit...Ch. 6 - A cohort of hemophiliacs is followed to elicit...Ch. 6 - We have previously described Data Set LEAD.DAT (at...Ch. 6 - We have previously described Data Set LEAD.DAT (at...Ch. 6 - We have previously described Data Set LEAD.DAT (at...Ch. 6 - Data Set NIFED.DAT (at www.cengagebrain.com) was...Ch. 6 - Data Set NIFED.DAT (at www.cengagebrain.com) was...Ch. 6 - Data Set NIFED.DAT (at www.cengagebrain.com) was...Ch. 6 - Suppose that there are 6 deaths due to bladder...Ch. 6 - Suppose that there are 4 deaths due to stomach...Ch. 6 - The value of mammography as a screening test for...Ch. 6 - The value of mammography as a screening test for...Ch. 6 - The value of mammography as a screening test for...Ch. 6 - The value of mammography as a screening test for...Ch. 6 - On the computer, draw 1000 bootstrap samples of...Ch. 6 - On the computer, draw 1000 bootstrap samples of...Ch. 6 - A study was performed to investigate the...Ch. 6 - A study was performed to investigate the...Ch. 6 - Refer to Data Set BONEDEN.DAT at...Ch. 6 - Refer to Data Set BONEDEN.DAT at...Ch. 6 - Prob. 88PCh. 6 - Prob. 89PCh. 6 - Prob. 90PCh. 6 - Prob. 91PCh. 6 - Prob. 92PCh. 6 - Prob. 93PCh. 6 - Prob. 94PCh. 6 - Prob. 95PCh. 6 - Prob. 96PCh. 6 - A patient who is taking antihypertensive...Ch. 6 - A patient who is taking antihypertensive...Ch. 6 - A patient who is taking antihypertensive...Ch. 6 - A patient who is taking antihypertensive...Ch. 6 - A patient who is taking antihypertensive...Ch. 6 - Injuries are common in football and may be related...Ch. 6 - Injuries are common in football and may be related...Ch. 6 - A hypertensive patient has been on...Ch. 6 - A hypertensive patient has been on...Ch. 6 - A hypertensive patient has been on...Ch. 6 - A hypertensive patient has been on...Ch. 6 - A radiologist investigates whether a new (less...Ch. 6 - A radiologist investigates whether a new (less...Ch. 6 - The estimation of allele probabilities is...Ch. 6 - The estimation of allele probabilities is...Ch. 6 - The estimation of allele probabilities is...Ch. 6 - As an experiment, 10,000 people are completely...Ch. 6 - As an experiment, 10,000 people are completely...Ch. 6 - Which of the following sample results yields a 95%...Ch. 6 - Suppose we observe 30 cases of colon cancer over...
Knowledge Booster


Learn more about
Need a deep-dive on the concept behind this application? Look no further. Learn more about this topic, statistics and related others by exploring similar questions and additional content below.Similar questions
- A study is performed to examine the relationship between the concentration of plasma antioxidant vitamins and cancer risk. Table 7-66, shows data for plasma vitamin-A concentration in stomach cancer patients and in controls (participants similar to the cancer patients but free of disease). Is there a significant vitamins between patients with stomach cancer and controls? Run the appropriate test at a 5% level of significance.arrow_forwardThe death rate per 100,000 for lung cancer is 7 among non-smokers and 71 among smokers. The death rate per 100,000 for coronary thrombosis is 422 among non-smokers and 599 among smokers. The prevalence of smoking in the population is 55%. The relative risk of dying for a smoker compared to a non-smoker is: [Refer to the chapter titled “Study Designs: Cohort Studies”] A. 9.1 for lung cancer and 0.30 for coronary thrombosis. B. 10.1 for lung cancer and 1.4 for coronary thrombosis. C. 10.1 for lung cancer and 8.4 for coronary thrombosis. D. 9.1 for lung cancer and 1.4 for coronary thrombosis. E. 12.4 for lung cancer and 1.7 for coronary thrombosis.arrow_forwardCould it be that smoking actually increases survival rates among women? The accompanying data represent the 20-year survival status and smoking status of 1339 women who participated in a 20-year cohort study. Complete parts (a) through (e).arrow_forward
- A researcher is interested in the relationship between total student debt after graduating college and depression. In order to test the hypothesis that students with more debt are more depressed, the researcher conducts a cross-sectional study that inquires about indebtedness after graduation and asks participants to complete the geriatric depression scale (GDS) test to quantify their depression on a scale of 1-15, 15 being the most depressed. The following table should be considered a SRS of participants’ responses relative to the variables of interest. Indebtedness at Graduation ($) Performance on GDS (1-15) 75,438 8 89,653 9 112,653 11 109,563 10 56,863 6 A) Calculate basic descriptive statistics for your predictor and outcome variables. B) Perform a formal test addressing the correlation between your predictor and outcome variables. (Use alpha = 0.05). C) Interpret your results.arrow_forwardAnemia (low healthy blood cells or hemoglobin) has an important role in exercise performance. However, the direct link between rapid changes of hemoglobin and exercise performance is still unknown. A study investigated 18 patients with a blood disorder (beta-thalassemia). Participants in the study performed an exercise test before and the day after receiving a blood transfusion. Data are given in the table. HB = Hemoglobin RER = Respiratory exchange ID Change in HB Obese RER > 1.1 ratio No No 1 -1.4 No -1.5 No Yes No Yes 3 -2 No 4 -2.1 No -1.9 Yes Yes No -1.6 -1.8 -0.8 6 7 No Yes No Yes 8 9. -1 No No -1.2 No Yes 10 11 No No -0.8 -1.5 12 Yes No No Yes 13 14 -1.4 -2.6 -1.7 No No Yes Yes 15 Yes No Yes Yes 16 -2.6 No 17 18 -2.7 -1.5 Noarrow_forwardPassive exposure to environmental tobacco smoke has been associated with growth suppression and an increased frequency of respiratory tract infections in normal children. Is this association more pronounced in children with cystic fibrosis? To answer this question, 43 children (18 girls and 25 boys) attending a 2-week summer camp for cystic fibrosis patients were studied (New England Journal of Medicine, Sept. 20, 1990). Among several variables measured were the child's weight percentile (y) and the number of cigarettes smoked per day in the child's home (x). a. For the 18 girls, the coefficient of correlation between y and x was reported as r = –.50. Interpret - this result. b. Refer to part a. The p-value for testing Ho: p = 0 against H;: p # 0 was reported as p = .03. n Interpret this result. c. For the 25 boys, the coefficient of correlation between y and x was reported asr = -.12. Interpret %3D %3D this result. d. Refer to part c. The p-value for testing Ho: p = 0 against Ha: p #…arrow_forward
- Reduced heart rate variability (HRV) is known to be a predictor of mortality after a heart attack. One measure of HRV is the average normal-to-normal beat interval (in milliseconds) for a 24-hr time period. Twenty-two heart attack patients who were dog owners and 80 heart attack patients who did not own a dog participated in a study of the effect of pet ownership on HRV, resulting in the summary statistics shown in the accompanying table.arrow_forwardLeft ventricular mass (LVM) is an important risk factor for subsequent cardiovascular disease. A study is proposed to assess the relationship between childhood blood-pressure levels and LVM in children as determined from echocardiograms. The goal is to stratify children into a normal bp group (< 90th percentile for their age, gender, and height) and an elevated bp group (≥ 90th percentile for their age, gender, and height) and compare change in LVM between the two groups. Before this can be done, one needs to demonstrate that LVM actually changes in children over a 4-year period. To help plan the main study, a pilot study is conducted where echocardiograms are obtained from 10 random children from the Bogalusa Heart Study at baseline and after 4 years of follow-up. The data are given in Table 1 . Table 1 Pilot data on left ventricular mass (LVM) in children from the Bogalusa Heart Study ID Baseline LVM (g) 4- year LVM (g) Change (g)* 1 139 163 24 2 134 126 -8 3 86 142 56…arrow_forwardReduced heart rate variability (HRV) is known to be a predictor of mortality after a heart attack. One measure of HRV is the average normal-to-normal beat interval (in milliseconds) for a 24-hr time period. Twenty-two heart attack patients who were dog owners and 80 heart attack patients who did not own a dog participated in a study of the effect of pet ownership on HRV, resulting in the summary statistics shown in the accompanying table. Measure of HRV(Average Normal-to-Normal Beat Interval) Mean StandardDeviation Owns Dog 871 134 Does Not Own Dog 800 138 (b) The paper indicates that the null hypothesis in part (a) was rejected and reported that the P-value was less than 0.05. Carry out a two-sample t test. (Use ? = 0.05. Use ?1 for heart attack patients who are dog owners and ?2 for heart attack patients who do not own a dog.) Find the test statistic and P-value. (Use SALT. Round your test statistic to one decimal place and your P-value to three decimal places.) t=…arrow_forward
arrow_back_ios
arrow_forward_ios
Recommended textbooks for you
 Glencoe Algebra 1, Student Edition, 9780079039897...AlgebraISBN:9780079039897Author:CarterPublisher:McGraw Hill
 Big Ideas Math A Bridge To Success Algebra 1: Stu...AlgebraISBN:9781680331141Author:HOUGHTON MIFFLIN HARCOURTPublisher:Houghton Mifflin Harcourt
Glencoe Algebra 1, Student Edition, 9780079039897...
Algebra
ISBN:9780079039897
Author:Carter
Publisher:McGraw Hill
Big Ideas Math A Bridge To Success Algebra 1: Stu...
Algebra
ISBN:9781680331141
Author:HOUGHTON MIFFLIN HARCOURT
Publisher:Houghton Mifflin Harcourt
Correlation Vs Regression: Difference Between them with definition & Comparison Chart; Author: Key Differences;https://www.youtube.com/watch?v=Ou2QGSJVd0U;License: Standard YouTube License, CC-BY
Correlation and Regression: Concepts with Illustrative examples; Author: LEARN & APPLY : Lean and Six Sigma;https://www.youtube.com/watch?v=xTpHD5WLuoA;License: Standard YouTube License, CC-BY