
Videos
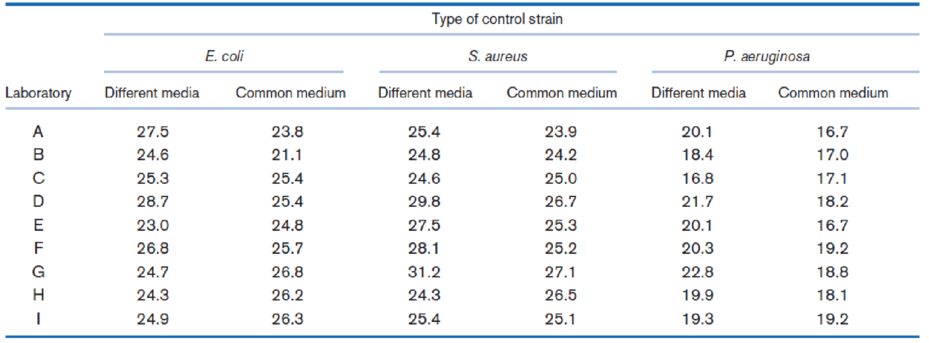
A nine-laboratory cooperative study was performed to evaluate quality control for susceptibility tests with 30-μg netilmicin disks [6]. Each laboratory tested three standard control strains on a different lot of Mueller-Hinton agar, with 150 tests performed per laboratory. For protocol control, each laboratory also performed 15 additional tests on each of the control strains using the same lot of Mueller-Hinton agar across laboratories. The
Answer Problem 6.18 assuming each laboratory uses a common medium to perform the susceptibility tests.
Provide a point and
Table 6.11 Mean zone diameters with 30-μg netilmicin disks tested in nine separate laboratories

Trending nowThis is a popular solution!

Chapter 6 Solutions
Fundamentals of Biostatistics


- A nine-laboratory cooperative study was performed toevaluate quality control for susceptibility tests with 30-μgnetilmicin disks . Each laboratory tested three standardcontrol strains on a different lot of Mueller-Hinton agar, with150 tests performed per laboratory. For protocol control,each laboratory also performed 15 additional tests on eachof the control strains using the same lot of Mueller-Hintonagar across laboratories. The mean zone diameters for eachof the nine laboratories are given in the image.Problem a ) Provide a point and interval estimate (95% CI) forthe mean zone diameter across laboratories for each typeof control strain, assuming each laboratory uses differentmedia to perform the susceptibility tests.Problem b ) Answer Problem a assuming each laboratory usesa common medium to perform the susceptibility tests.Problem c ) Provide a point and interval estimate (95% CI) for theinterlaboratory standard deviation of mean zone diametersfor each type of control strain,…arrow_forwardFive samples of a ferrous-type substance were used to determine if there is a difference between a laboratory chemical analysis and an X-ray fluorescence analysis of the iron content. Each sample was split into two subsamples and the two types of analysis were applied, with the accompanying results. Assuming that the populations are normal, test at the 0.10 level of significance whether the two methods of analysis give, on the average, the same result.arrow_forwardTwo subspecies of dark-eyed juncos were studied by D. Cristol et al. One of the sub- species migrates each year, and the other does not. Several characteristics of 14 birds of each subspecies were measured, one of which was wing length. The following data, based on the results of the researchers, provide the wing lengths, in millimeters, for the samples of two subspecies. Assume that wing lengths in populations of subspecies are normally distributed.Migratory: n = 14, x ̄ = 82.1, s = 1.5 111Non-migratory: n = 14, x ̄ = 84.92, s = 1.69 222Conduct a hypothesis test to determine if the average wing lengths in two populations of subspecies are significantly different.(i.) State the hypotheses.(ii.) Test for equality of unknown population variances. (iii.) Calculate test statistic.(iv.) Calculate degrees of freedom.(v.) Calculate the p−value of the test.(vi.) State your decision based on the p−value.(vii.) Write the interpretationarrow_forward
- The drug BGH (Bovine Growth Hormone) is reported to increase the milk production in dairy cows. It is known that the average milk production of dairy cows not using BGH is 58 pounds per day. The drug was tested on nine randomly selected dairy cows and the following weights were recorded: 59, 48, 66, 65, 80, 73, 69, 62, 70. a. Construct a 95% CI for the mean weight of milk produced by cows using BGH. b. Interpret this CI, what can you say about the effect of BGH on production?arrow_forwardFive samples of a ferrous-type substance were used to determine if there is a difference between a laboratory chemical analysis and an X-ray fluorescence analysis of the iron content. Each sample was split into two subsamples and the two types of analysis were applied, with the accompanying results. Assuming that the populations are normal, test at the 0.02 level of significance whether the two methods of analysis give, on the average, the same resultarrow_forwardBlood cocaine concentration (mg/L) was determinedboth for a sample of individuals who had died fromcocaine-induced excited delirium (ED) and for a sampleof those who had died from a cocaine overdose withoutexcited delirium; survival time for people in bothgroups was at most 6 hours. The accompanying datawas read from a comparative boxplot in the article“Fatal Excited Delirium Following Cocaine Use” (J.of Forensic Sciences, 1997: 25–31). ED 0 0 0 0 .1 .1 .1 .1 .2 .2 .3 .3.3 .4 .5 .7 .8 1.0 1.5 2.7 2.83.5 4.0 8.9 9.2 11.7 21.0Non-ED 0 0 0 0 0 .1 .1 .1 .1 .2 .2 .2.3 .3 .3 .4 .5 .5 .6 .8 .9 1.01.2 1.4 1.5 1.7 2.0 3.2 3.5 4.14.3 4.8 5.0 5.6 5.9 6.0 6.4 7.98.3 8.7 9.1 9.6 9.9 11.0 11.512.2 12.7 14.0 16.6 17.8 a. Determine the medians, fourths, and fourth spreadsfor the two samples.b. Are there any outliers in either sample? Any extremeoutliers?c. Construct a comparative boxplot, and use it as abasis for comparing and contrasting the ED andnon-ED samples.arrow_forward
- Five samples of a ferrous-type substance were used to determine if there is a difference between a laboratory chemical analysis and an X-ray fluorescence analysis of the iron content. Each sample was split into two subsamples and the two types of analysis were applied, with the accompanying results. Assuming that the populations are normal, test at the 0.02 level of significance whether the two methods of analysis give, on the average, the same result. Click here to view the sample analyses. Click here to view page 1 of the table of critical values of the t-distribution. Click here to view page 2 of the table of critical values of the t-distribution. Let sample 1 be the X-ray fluorescence results and let sample 2 be the laboratory chemical results. State the null and alternative hypotheses. Ho: HD H1: HD + Identify the critical region. Select the correct choice below and fill in the answer box(es) to complete your choice. (Round to three decimal places as needed.) O A. t> В. t O C. t<arrow_forwardatients suffering from rheumatic diseases or osteoporosis often suffer critical losses in bone mineral density (BMD). Alendronate is one medication prescribed to build or prevent further loss of BMD. Holcomb and Rothenberg (A-3) looked at 96 women taking alendronate to determine if a difference existed in the mean percent change in BMD among five different primary diagnosis classifications. Group 1 patients were diagnosed with rheumatoid arthritis (RA). Group 2 patients were a mixed collection of patients with diseases including lupus, Wegener’s granulomatosis and polyarteritis, and other vasculitic diseases (LUPUS). Group 3 patients had polymyalgia rheumatica or temporal arthritis (PMRTA). Group 4 patients had osteoarthritis (OA) and group 5 patients had osteoporosis (O) with no other rheumatic diseases identified in the medical record. Changes in BMD are shown in the following table. Discuss the Alendronate medication data in terms of variability. To determine if a difference…arrow_forwardTardigrades, or water bears, are a type of micro-animal famous for their resilience. In examining the effects of radiation on organisms, an expert claimed that the amount of gamma radiation needed to sterilize a colony of tardigrades no longer has a mean of 1350 Gy (grays). (For comparison, humans cannot withstand more than 10 Gy .) A study was conducted on a sample of 18 randomly selected tardigrade colonies, finding that the amount of gamma radiation needed to sterilize a colony had a sample mean of 1375 Gy , with a sample standard deviation of 75 Gy . Assume that the population of amounts of gamma radiation needed to sterilize a colony of tardigrades is approximately normally distributed. Complete the parts below to perform a hypothesis test to see if there is enough evidence, at the 0.05 level of significance, to support the claim that μ , the mean amount of gamma radiation needed to sterilize a colony of tardigrades, is not equal to 1350 Gy .arrow_forward
- Tardigrades, or water bears, are a type of micro-animal famous for their resilience. In examining the effects of radiation on arganisms, an expert claimed that the amount of gamma radiation needed to sterilize a colany of tardigrades no longer has a mean of 1200 Gy (grays). (For comparison, humans cannot withstand more than 10 Gy.) A study was conducted on a sample of 21 randomly selected tardigrade colonies, finding that the amount of gamma radiation needed to sterilize a colony had a sample mean af 1225 Gy, with a sample standard deviation of 65 Gy. Assume that the population of amounts of gamma radiation needed to sterilize a colony of tardigrades is approximately normally distributed. Complete the parts below to perform a hypothesis test to see if there is enough evidence, at the 0.10 level af significance, to support the claim that H, the mean amount of gamma radiation needed to sterilize a colony of tardigrades, is nat equal to 1200 Gy. (a) State the null hypothesis and the…arrow_forwardA quality control manager has concerns about the occurrence of defects on acomponent assembly used in the fabrication of an aircraft wing. The manufacturing plantoperates with three shifts, and three particular types of defects are of concern. The followingtable shows the count of defects of each type across the shifts from a random sample of 300assemblies with defects from a week of production. Test whether the types of defects are independent of the shifts. Perform the test on the 5%level. What is your conclusion?arrow_forwardThe Paleo diet allows only for foods that humans typically consumed over the last 2.5 million years, excluding those agriculture-type foods that arose during the last 10,000 years or so. Researchers randomly divided 500 volunteers into two equal-sized groups. One group spent 6 months on the Paleo diet. The other group received a pamphlet about controlling portion sizes. A randomized treatment assignment was performed, and at the beginning of the study, the average difference in weights between the two groups was about 0 pounds. After the study, the Paleo group had lost an average of 7.1 pounds with a standard deviation of 22.75 pounds while the control group had lost an average of 4.5 pounds with a standard deviation of 11.5 pounds. After failing to reject the null hypothesis support your answer with a p-value (a) P-value = _______arrow_forward
 Glencoe Algebra 1, Student Edition, 9780079039897...AlgebraISBN:9780079039897Author:CarterPublisher:McGraw Hill