
MATLAB: An Introduction with Applications
6th Edition
ISBN: 9781119256830
Author: Amos Gilat
Publisher: John Wiley & Sons Inc
expand_more
expand_more
format_list_bulleted
Related questions
Concept explainers
Topic Video
Question
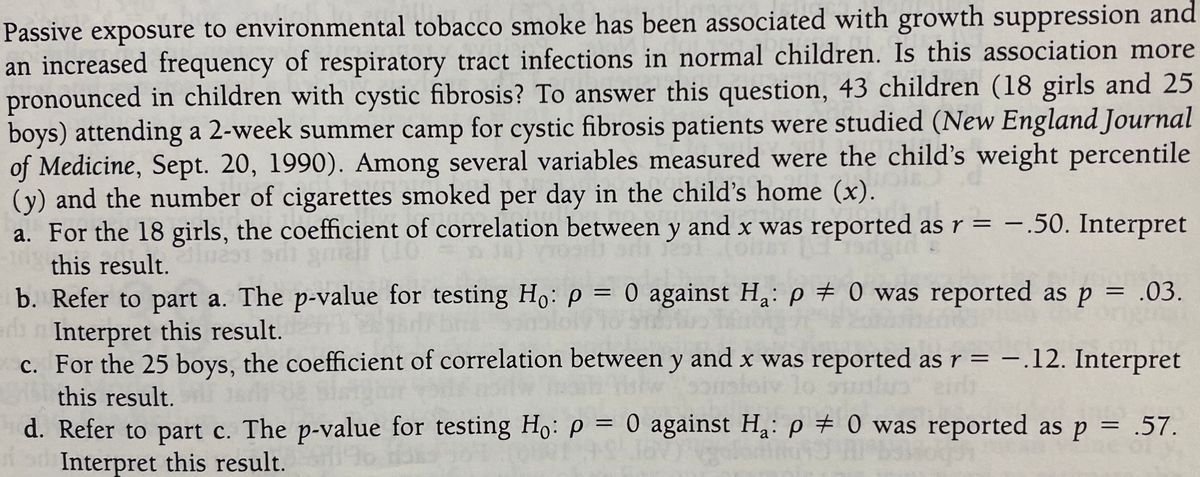

Transcribed Image Text:Passive exposure to environmental tobacco smoke has been associated with growth suppression and
an increased frequency of respiratory tract infections in normal children. Is this association more
pronounced in children with cystic fibrosis? To answer this question, 43 children (18 girls and 25
boys) attending a 2-week summer camp for cystic fibrosis patients were studied (New England Journal
of Medicine, Sept. 20, 1990). Among several variables measured were the child's weight percentile
(y) and the number of cigarettes smoked per day in the child's home (x).
a. For the 18 girls, the coefficient of correlation between y and x was reported as r = –.50. Interpret
-
this result.
b. Refer to part a. The p-value for testing Ho: p = 0 against H;: p # 0 was reported as p = .03.
n Interpret this result.
c. For the 25 boys, the coefficient of correlation between y and x was reported asr = -.12. Interpret
%3D
%3D
this result.
d. Refer to part c. The p-value for testing Ho: p = 0 against Ha: p # 0 was reported as p = .57.
Interpret this result.
%3D
Expert Solution
This question has been solved!
Explore an expertly crafted, step-by-step solution for a thorough understanding of key concepts.

This is a popular solution

Trending nowThis is a popular solution!

Step by stepSolved in 2 steps

Knowledge Booster


Learn more about
Need a deep-dive on the concept behind this application? Look no further. Learn more about this topic, statistics and related others by exploring similar questions and additional content below.Similar questions
- The researchers reported: Consumer masculinity was strongly correlated with appearance-related self-esteem (r = 0.40, p < .001) and media influence (r = 0.62, p < .001), but not correlated with overall self-esteem (r = 0.08, p > .05). a. State the correlations that were significant. b. Which correlation was the strongest?arrow_forward6.50 How's it going?: The American National Election Studies (ANES) collects data on voter attitudes and intentions as well as demographic information. In this question we will focus on two variables from the ANES dataset (ANES, 2012). region (levels: Northeast, North Central, South, and West) whether the respondent feels things in this country are generally going in the right direction or things have pretty seriously gotten off on the wrong track To keep calculations simple we will work with a random sample of 500 respondents from the ANES dataset. The distribution of responses are as folows: Right Direction Wrong Track Total Northeast 29 54 83 North Central 44 77 121 South 62 131 193 West 36 67 103 Total 171 329 500 There are TWO parts to this question. One is a Chi-Squared GOF and one is a Chi-Squared Test for Independence. Think about the differences between the two tests to determine which one to use on which part. a) Region: According to the 2010 Census, 18% of US residents live…arrow_forwardA small study (n=10) is designed to assess if there is an association between smoking in pregnancy and low birth weight. Low birth weight babies are those born less than 5.5 pounds. The following data represent the birth weights, in pounds, of babies born to mothers who reported smoking in pregnancy and those who did not. Mother smoked in pregnancy 5.0 4.2 4.8 3.3 3.9 Mother did not smoke during pregnancy 5.1 4.9 5.3 5.4 4.6 Is there a significant difference in birth weights between mother who smoked during pregnancy and those who did not? Apply the Mann Whitney U Test at a 5% level of significance. Complete the table below. Total Sample (Ordered Smallest to Largest) Ranks Mother Smoked in Pregnancy Mother Did Not Smoke in Pregnancy Rank Smoked Did Not Smoke Smoked Did Not Smoke 5.0 5.1 1 3.3 4.2 4.9 2…arrow_forward
- 3.A study of the effect of smoking on sleep patterns was carried out. The observedtime required to fail asieep in minutes. These data were obtained: measure of Smokers :69.3,56.0,22.1,47.6,53.2,48.1,52.7,34.4,60.2 ,43.8,23.2.13.8 Non-smoker:28.6,25.1,26.4,34.9,29.8,28.4,38.5,30.2,30.6,31.8,41.6,21.1,36.0,37,13.9. a. Find the sample mean for each group. b. Determine the standard deviation of the sample for each group. c. Give your comments about the comparison of the mean and standard deviation of the tw groups above. d. If the statistical inferential stage is ignored, what conclusions can be drawn from the above study?arrow_forward4) a. What is the SST value for the data? What is the F value for the drug factor? b. What is the F value for the sex factor? What is the F value for the interaction? What is the conclusion you make based on these F values? c.What is the conclusion you make based on these F values? Neither factor significantly influences the mean value, but there is a significant interaction which influences the mean value. Both factors influence the mean value, but there is no significant interaction. The sex significantly influences the mean value and there is a significant interaction, but the drug does not significantly influence the mean value. The sex significantly influences the mean value, but there is no significant interaction nor does the drug significantly influence the mean value. The drug significantly influences the mean value, but there is no significant interaction nor does the sex significantly influence the mean value. The drug significantly…arrow_forward1. Metal Tags on Penguins and Length of Foraging Trips. Data were collected over a 10-year timespan from a sample of penguins that were randomly given either metal or electronic tags. One variable examined is the length of foraging trips. Longer foraging trips can jeopardize both breeding success and survival of chicks waiting for food. From a sample of 344 foraging trips for metal-tagged penguins, the mean length was 12.70 days. From a sample of 512 foraging trips for electronic-tagged penguins, mean length was 11.60 days. Test whether foraging trips are longer on average among metal-tagged penguins than among electronic-tagged penguins. a. State hypotheses in terms of two means. b. Calculate the sample statistic XM - XE c. An estimate of the standard error for this difference of means is SE-0.2834. Calculate a test statistic to two decimal places. d. What is the correct theoretical distribution for this test? ☐Normal ☐t with degrees of freedom e. Find the p-value and draw a…arrow_forward
- The article "Vehicle-Arrival Characteristics at Urban Uncontrolled Intersections" (V. Rengaraju and V. Rao, Journal of Transportation Engineering, 1995: 317-323) presents data on traffic characteristics at 10 intersections in Madras, India. One characteristic measured was the speeds of the vehicles traveling through the intersections. The accompanying table gives the 15th, 50th, and 85th percentiles of speed (in km/h) for two intersections. Percentile Intersection 15th 50th 85th 27.5 37.5 40.0 в 24.5 26.5 36.0 If a histogram for speeds of vehicles through intersection A were drawn, would it most likely be skewed to the left, skewed to the right, or approximately symmetric? Explain. b. If a histogram for speeds of vehicles through intersection B were drawn, would it most likely be skewed to the left, skewed to the right, or approximately symmetric? Explain. a.arrow_forwardPast records suggest that the mean annual income, µ,, of teachers in state of New York is less than or equal to the mean annual income, µ,, of teachers in Illinois. In a current study, a random sample of 15 teachers from New York and an independent random sample of 15 teachers from Illinois have been asked to report their mean annual income. The data obtained are as follows: Annual income in dollars New York 46406, 43039, 47083, 47056, 46810, 47074, 43524, 59524, 49763, 48083, 46100, 53904, 43171, 44341, 52229 Illinois 53010, 43485, 39037, 47622, 47151, 50372, 41401, 35007, 40591, 49268, 44782, 39668, 52555, 49976, 49207 The population standard deviation for mean annual income of teachers in New York and in Illinois are estimated as 6600 and 6200, respectively. It is also known that both populations are approximately normally distributed. At the 0.01 level of significance, is there sufficient evidence to reject the claim that the mean annual income of teachers in state of New York is…arrow_forwardPLEASE ANSWER ASAP: A case-control study was conducted to evaluate the relationship between physical activity and coronary heart disease (CHD) in men. A total of 406 men newly diagnosed with CHD were included together with 406 men of similar ages who did not have CHD. The risk of CHD (measured by the OR) was higher among men who were inactive or only moderately active (collectively called ‘inactive’) than among those who were physically active: (See attached image) Odds ratio for inactive men compared to active men= (299 x 136)/(270 x 107)=1.41Suppose there is no misclassification in these data.What would the observed OR have been... 1. If 20% of all the inactive men had been misclassified as active? 2. If 10 % of inactive cases had been misclassified as active?arrow_forward
- A clinical psychologist is investigating the relationship between sleep and feelings ofanxiety. For a sample of 15 individuals, he asks each participant to indicate how many hours theytypically sleep each night and each participant also completes an anxiety assessment. The followingdata is obtained:Hours of sleep: M=6.0 SS=16.0Anxiety scores: M=8.0 SS=64.0SP = - 20.0 a. Compute the correlation between hours of sleep and anxiety scores.arrow_forwardTourism is extremely important to the economy of Florida. Hotel occupancy is an often-reported measure of visitor volume and visitor activity (Orlando Sentinel, May 19, 2018). Hotel occupancy data for February in two consecutive years are as follows. Current Year Previous Year Occupied Rooms 1,435 1,501 Total Rooms 1,750 1,900 a. Formulate the hypothesis test that can be used to determine whether there has been an increase in the proportion of rooms occupied over the one-year period. Let pi = population proportion of rooms occupied for current year P2 = population proportion of rooms occupied for previous year Ho : P1 – P2 less than or equal to 0 Ha : Pi – P2 greater than 0 b. What is the estimated proportion of hotel rooms occupied each year (to 2 decimals)? Current year Previous Year c. Conduct a hypothesis test. What is the p-value (to 4 decimals)? Use Table 1 from Appendix B. p-valuearrow_forwardWhat was the power for this study?arrow_forward
arrow_back_ios
SEE MORE QUESTIONS
arrow_forward_ios
Recommended textbooks for you
- MATLAB: An Introduction with ApplicationsStatisticsISBN:9781119256830Author:Amos GilatPublisher:John Wiley & Sons Inc
 Probability and Statistics for Engineering and th...StatisticsISBN:9781305251809Author:Jay L. DevorePublisher:Cengage Learning
 Statistics for The Behavioral Sciences (MindTap C...StatisticsISBN:9781305504912Author:Frederick J Gravetter, Larry B. WallnauPublisher:Cengage Learning
  Elementary Statistics: Picturing the World (7th E...StatisticsISBN:9780134683416Author:Ron Larson, Betsy FarberPublisher:PEARSON
 The Basic Practice of StatisticsStatisticsISBN:9781319042578Author:David S. Moore, William I. Notz, Michael A. FlignerPublisher:W. H. Freeman
 Introduction to the Practice of StatisticsStatisticsISBN:9781319013387Author:David S. Moore, George P. McCabe, Bruce A. CraigPublisher:W. H. Freeman
MATLAB: An Introduction with Applications
Statistics
ISBN:9781119256830
Author:Amos Gilat
Publisher:John Wiley & Sons Inc
Probability and Statistics for Engineering and th...
Statistics
ISBN:9781305251809
Author:Jay L. Devore
Publisher:Cengage Learning
Statistics for The Behavioral Sciences (MindTap C...
Statistics
ISBN:9781305504912
Author:Frederick J Gravetter, Larry B. Wallnau
Publisher:Cengage Learning
Elementary Statistics: Picturing the World (7th E...
Statistics
ISBN:9780134683416
Author:Ron Larson, Betsy Farber
Publisher:PEARSON
The Basic Practice of Statistics
Statistics
ISBN:9781319042578
Author:David S. Moore, William I. Notz, Michael A. Fligner
Publisher:W. H. Freeman
Introduction to the Practice of Statistics
Statistics
ISBN:9781319013387
Author:David S. Moore, George P. McCabe, Bruce A. Craig
Publisher:W. H. Freeman