
Concept explainers
Videos
a)
To find the
a)
Answer to Problem 9E
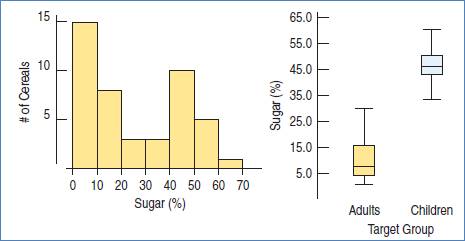
The range is between 0% to 70%.
Explanation of Solution
Given:

Calculation:
Above histogram shows the range of the sugar in cereals is between 0% to 70%.
b)
To explain the shape of the distribution.
b)
Answer to Problem 9E
It is bimodal.
Explanation of Solution
Given:

Calculation:
The histogram having two peaks; therefore, it has bimodal distribution.
c)
To explain the aspects of breakfast.
c)
Answer to Problem 9E
The fact is amount of sugar.
Explanation of Solution
Given:

Calculation:
As we know, the cereals of adults contain very low percentage of sugar. But the cereals of children contain high percentage of sugar.
d)
To explain whether sugar is higher in cereals of children than adults.
d)
Answer to Problem 9E
Yes.
Explanation of Solution
Given:
Calculation:
The cereals of adults contain very low percentage of sugar. But the cereals of children contain high percentage of sugar. The boxplot also suggests the same.
e)
To explain which group varies more in sugar content.
e)
Answer to Problem 9E
Adult.
Explanation of Solution
Given:

Calculation:
The IQR of adult cereals is higher than the children. Hence, adult sugar content varies more than children.
Chapter 5 Solutions
Stats: Modeling the World Nasta Edition Grades 9-12
Additional Math Textbook Solutions
Basic Business Statistics, Student Value Edition (13th Edition)
Elementary Statistics (13th Edition)
Elementary Statistics: Picturing the World (6th Edition)
Introductory Statistics
Statistical Reasoning for Everyday Life (5th Edition)
Essentials of Statistics (6th Edition)


 MATLAB: An Introduction with ApplicationsStatisticsISBN:9781119256830Author:Amos GilatPublisher:John Wiley & Sons Inc
 Probability and Statistics for Engineering and th...StatisticsISBN:9781305251809Author:Jay L. DevorePublisher:Cengage Learning
 Statistics for The Behavioral Sciences (MindTap C...StatisticsISBN:9781305504912Author:Frederick J Gravetter, Larry B. WallnauPublisher:Cengage Learning
 Elementary Statistics: Picturing the World (7th E...StatisticsISBN:9780134683416Author:Ron Larson, Betsy FarberPublisher:PEARSON
 The Basic Practice of StatisticsStatisticsISBN:9781319042578Author:David S. Moore, William I. Notz, Michael A. FlignerPublisher:W. H. Freeman
 Introduction to the Practice of StatisticsStatisticsISBN:9781319013387Author:David S. Moore, George P. McCabe, Bruce A. CraigPublisher:W. H. Freeman