
Concept explainers
Videos
a)
To explain features of the distribution from Histogram and boxplot.
a)
Answer to Problem 7E
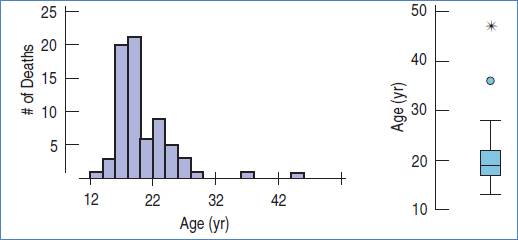
The Histogram and boxplot shows the distribution unimodal and right skewed.
Explanation of Solution
Given:

Calculation:
The Histogram and boxplot shows the distribution unimodal and right skewed. There are two outliers shows around 37 and 47. The
b)
To explain features of the distribution, include on Histogram but not in boxplot.
b)
Answer to Problem 7E
The unimodal shape of the distribution.
Explanation of Solution
Given:

Calculation:
The Histogram suggests that the distribution unimodal with increasing between 22 and 24. This shape does not see clear in Boxplot.
c)
To explain which summary statistics is useful to summarize the center of the distribution.
c)
Answer to Problem 7E
Median.
Explanation of Solution
Given:
Calculation:
As the shape of the distribution is right skewed, I would prefer median as an appropriate summary statistic.
d)
To explain which summary statistics is useful to summarize the spread of the distribution.
d)
Answer to Problem 7E
IQR.
Explanation of Solution
Given:

Calculation:
As the shape of the distribution is right skewed, I would prefer IQR as an appropriate summary statistic.
Chapter 5 Solutions
Stats: Modeling the World Nasta Edition Grades 9-12
Additional Math Textbook Solutions
Statistics: The Art and Science of Learning from Data (4th Edition)
Elementary Statistics: Picturing the World (6th Edition)
Introductory Statistics (2nd Edition)
Elementary Statistics: Picturing the World (7th Edition)
An Introduction to Mathematical Statistics and Its Applications (6th Edition)
Essentials of Statistics (6th Edition)


 MATLAB: An Introduction with ApplicationsStatisticsISBN:9781119256830Author:Amos GilatPublisher:John Wiley & Sons Inc
 Probability and Statistics for Engineering and th...StatisticsISBN:9781305251809Author:Jay L. DevorePublisher:Cengage Learning
 Statistics for The Behavioral Sciences (MindTap C...StatisticsISBN:9781305504912Author:Frederick J Gravetter, Larry B. WallnauPublisher:Cengage Learning
 Elementary Statistics: Picturing the World (7th E...StatisticsISBN:9780134683416Author:Ron Larson, Betsy FarberPublisher:PEARSON
 The Basic Practice of StatisticsStatisticsISBN:9781319042578Author:David S. Moore, William I. Notz, Michael A. FlignerPublisher:W. H. Freeman
 Introduction to the Practice of StatisticsStatisticsISBN:9781319013387Author:David S. Moore, George P. McCabe, Bruce A. CraigPublisher:W. H. Freeman