
Videos
a)
To explain W’s for the data.
a)
Explanation of Solution
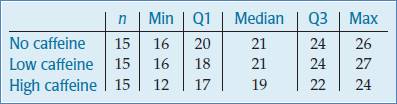
Given:

Let the general W’s are: Who, what, where, when and how.
We will see one by one.
Who: Volunteers or students.
What: Memory test
Where: Not given.
When: Not given.
Why: To find the effect of caffeine on memory retention.
How: Volunteers took a memory test 2 hours after drinking soda.
b)
To name variables with their type as categorical or quantitative.
b)
Explanation of Solution
Given:
The variables are: Types of soda and Memory test score.
The categorical variable: Types of soda.
The quantitative variable: Memory test score.
c)
To create a parallel boxplot.
c)
Explanation of Solution
Given:

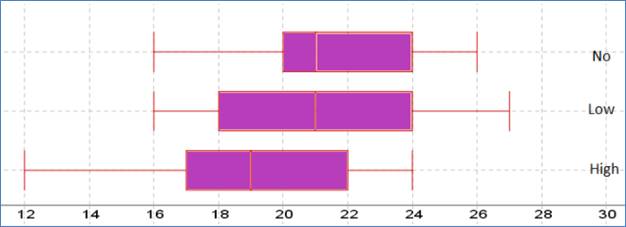
Following is the parallel boxplot:
d)
To explain the three groups.
d)
Explanation of Solution
Given:

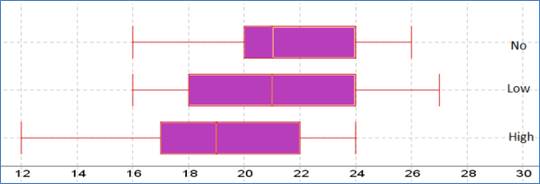
The shape of the distributions of No caffeine and High caffeine are left skewed. The shape of the distribution of Low caffeine is right skewed. The center of the distribution of No and Low caffeine is same. The spread of High caffeine is largest. But the spread of the No caffeine is smallest. There are no outliers represent by the boxplot.
Chapter 5 Solutions
Stats: Modeling the World Nasta Edition Grades 9-12
Additional Math Textbook Solutions
Basic Business Statistics, Student Value Edition
Basic Business Statistics, Student Value Edition (13th Edition)
Elementary Statistics: Picturing the World (7th Edition)
Essentials of Statistics (6th Edition)


 MATLAB: An Introduction with ApplicationsStatisticsISBN:9781119256830Author:Amos GilatPublisher:John Wiley & Sons Inc
 Probability and Statistics for Engineering and th...StatisticsISBN:9781305251809Author:Jay L. DevorePublisher:Cengage Learning
 Statistics for The Behavioral Sciences (MindTap C...StatisticsISBN:9781305504912Author:Frederick J Gravetter, Larry B. WallnauPublisher:Cengage Learning
 Elementary Statistics: Picturing the World (7th E...StatisticsISBN:9780134683416Author:Ron Larson, Betsy FarberPublisher:PEARSON
 The Basic Practice of StatisticsStatisticsISBN:9781319042578Author:David S. Moore, William I. Notz, Michael A. FlignerPublisher:W. H. Freeman
 Introduction to the Practice of StatisticsStatisticsISBN:9781319013387Author:David S. Moore, George P. McCabe, Bruce A. CraigPublisher:W. H. Freeman