
Concept explainers
Videos
To analyze:
The result and describe the pathway that is followed by the protein by plotting a fluorescence intensity versus time graph with the help of the given table.
Given:
The green fluorescent protein (GFP) gene is fused with the gene of the viral protein. The normal cell is infected and the movement of the protein is monitored using fluorescence imaging equipment. The table shown below summarizes the result of the experiment:
| Relative fluorescence intensity | ||||
| Time (minutes) | Endoplasmic reticulum (ER) | Golgi | Cell membrane | Total |
| 0 | 0.95 | 0.05 | 0.00 | 1.00 |
| 20 | 0.64 | 0.28 | 0.08 | 1.00 |
| 40 | 0.38 | 0.39 | 0.23 | 1.00 |
| 60 | 0.17 | 0.38 | 0.44 | 0.99 |
| 80 | 0.05 | 0.28 | 0.65 | 0.98 |
| 100 | 0.00 | 0.25 | 0.70 | 0.95 |
| 150 | 0.00 | 0.05 | 0.77 | 0.82 |
| 200 | 0.00 | 0.00 | 0.75 | 0.75 |
Introduction:
The GFP is a protein that fluoresces and is obtained from the aquatic animal called jellyfish, having the scientific name Aequorea victoria. It is made up of 238 amino acids. It emits green fluorescent light in the presence of ultraviolet light. GFP is used widely in biological techniques. For example, GFP gene is fused with the gene of the viral protein. The normal cell is then infected and the movement of the protein is monitored using fluorescence imaging equipment. This method is used to track the pathway that is traced by the protein.
Explanation of Solution
The graph of fluorescence intensity against time for the protein that is present in the ER is given below:
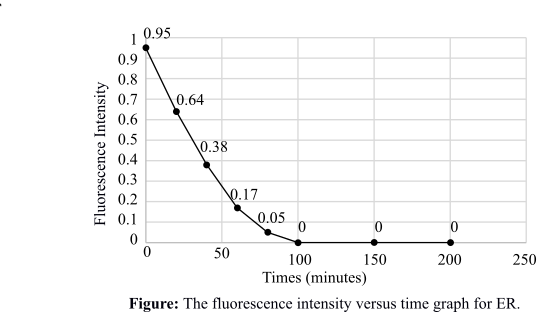
This graph depicts the intensity of fluorescence against time for the protein that is present in the ER. Initially, the fluorescence intensity is high, which means that the protein is entering the ER directly after synthesis. The graph plot is gradually decreasing, which is showing that the fluorescence in the ER is decreasing and reaching zero. This means that the fluorescent protein has moved out of the ER.
The graph of fluorescence intensity against time for the protein that is present in the Golgi apparatus is given below:
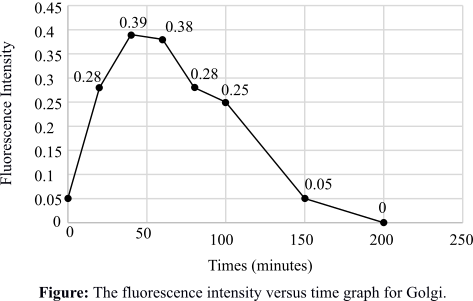
This graph depicts the intensity of fluorescence against time for the protein that is present in the Golgi apparatus. Initially, the fluorescence intensity is increasing, which means that the protein is entering the Golgi after a considerable time. The graph plot is gradually decreasing, which is showing that the fluorescence in the Golgi is decreasing and reaching zero. This means that the fluorescent protein is also moving out of the Golgi.
The graph of fluorescence intensity against time for the protein that is present in the cell membrane is given below:
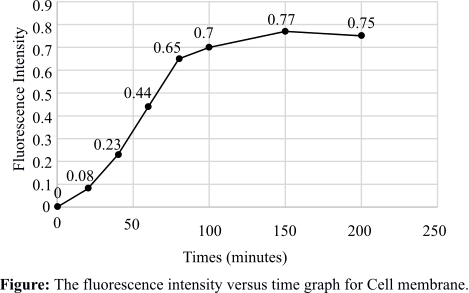
This graph depicts the intensity of fluorescence against time for the protein that is present in the cell membrane. The fluorescence intensity is increasing gradually and is maximized after some time, which means that the protein is embedded in the cell membrane.
The pathway that is followed by the protein is traced with the help of the graphs drawn. The protein enters the ER quickly after synthesis and then goes to the Golgi. From the Golgi, it moves to the cell membrane to form virus particles.
Therefore, the graphs are plotted and the pathway of the GFP fusion protein is traced with the help of the graphs. The pathway followed by the protein is from ER to Golgi and then to the cell membrane.
Want to see more full solutions like this?
Chapter 5 Solutions
Life: The Science of Biology


- Give typing answer with explanation and conclusion Which of the following is true under the following conditions: The enzyme concentration is 8 nM, the substrate concentration is 8 mM, and the KM is 8 μM.arrow_forwardDraw an alpha helix using ribbon diagram and use arrows to show the direction of the side chains.arrow_forwardGive typing answer with explanation and conclusion Why 70% Alcohol is better than 100% Alcohol (as an antiseptic) to control the growth of bacteria?arrow_forward
- Electrophoresis is a method used to sort proteins by their size. Why is a detergent added to the buffer? a) Because SDS forms micelles in which the proteins can be transported through the gel in b) Because SDS lowers the pH of the buffer c) Because SDS denaturs the protein d) Because smaller proteins move more slowly through the gel thenarrow_forwardGive Detailed explanation Solution..no need handwritten answerarrow_forwardPart a) Explain the entropic and enthalpic arguments for micelle formation. Part b) Explain the entropic and enthalpic arguments for a bilayer formation.arrow_forward
- Give a explanation Detailed Solution..no need handwrittenarrow_forwardComplete the table below from 1,2,3,4,5. Show solutionarrow_forwardWrite a short note on how to use a spectrometer to determine the concentration of glucose in an unknown solution. Mention how you will calibrate the spectrometer for this purpose. *arrow_forward
- Choose the combination of answers that most accurately completes the statement.The primary mode of action of nonionizing radiation is to a. produce superoxide ions c. denature proteins b. make pyrimidine dimers d. break disulfi de bondsarrow_forwardWhich would move faster in thin layer chromatography?a) Beeswaxb) Phosphatidylinositolc) Cholesterold) Steroidarrow_forward
 Human Anatomy & Physiology (11th Edition)BiologyISBN:9780134580999Author:Elaine N. Marieb, Katja N. HoehnPublisher:PEARSON
 Biology 2eBiologyISBN:9781947172517Author:Matthew Douglas, Jung Choi, Mary Ann ClarkPublisher:OpenStax
 Anatomy & PhysiologyBiologyISBN:9781259398629Author:McKinley, Michael P., O'loughlin, Valerie Dean, Bidle, Theresa StouterPublisher:Mcgraw Hill Education,
 Molecular Biology of the Cell (Sixth Edition)BiologyISBN:9780815344322Author:Bruce Alberts, Alexander D. Johnson, Julian Lewis, David Morgan, Martin Raff, Keith Roberts, Peter WalterPublisher:W. W. Norton & Company
 Laboratory Manual For Human Anatomy & PhysiologyBiologyISBN:9781260159363Author:Martin, Terry R., Prentice-craver, CynthiaPublisher:McGraw-Hill Publishing Co.
 Inquiry Into Life (16th Edition)BiologyISBN:9781260231700Author:Sylvia S. Mader, Michael WindelspechtPublisher:McGraw Hill Education