
Concept explainers
Videos
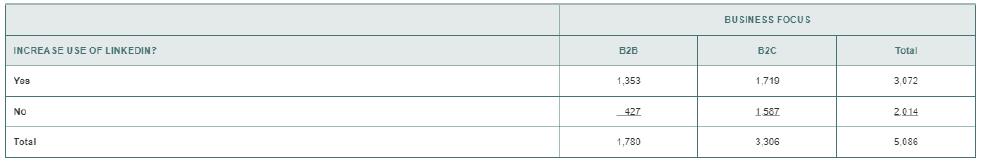
How will markers change their social media use in the near future? A survey by Social Media Examiner reported that
a. Give an example of a simple
b. Give an example of a joint event.
c. what is the complement of a marketer who plans to increases use of LinkedIn?
d. why is a marketer who plans to increase use of LinkedIn and is a B2C marketer a joint event?
Want to see the full answer?
Check out a sample textbook solution
Chapter 4 Solutions
Basic Business Statistics, Student Value Edition


- Recent research commissioned by Vodafone suggests that older workers are the happiest employees (BBC News, July 21, 2008). The report documents that 70% of older workers in England feel fulfilled, compared with just 50% of younger workers. A demographer believes that an identical pattern does not exist in Asia. A survey of 120 older workers in Asia finds that 75 feel fulfilled. A similar survey finds that 58% of 210 younger workers feel fulfilled. (You may find it useful to reference the appropriate table: z table or t table) At the 5% level of significance, test if older workers in Asia feel less fulfilled than their British counterparts. a-1. Select the null and the alternative hypotheses. multiple choice 1 H0: p = 0.70; HA: p ≠ 0.70 H0: p ≤ 0.70; HA: p > 0.70 H0: p ≥ 0.70; HA: p < 0.70 a-2. Calculate the sample proportion. (Round your answer to 3 decimal places.) a-3. Calculate the value of test statistic. (Negative value should be indicated…arrow_forwardSuppose you are conducting a study about how the average US worker spends time over the course of a workday. You are interested in how much time workers spend per day on personal calls, emails, and social networking websites, as well as how much time they spend socializing with coworkers versus actually working. The most recent census provides data for the entire population of US workers on variables such as travel time to work, time spent at work, and break time at work. The census, however, does not include data on the variables you are interested in, so you obtain a random sample of 102 full-time workers in the United States and ask about personal calls, emails, and so forth. You are curious about how your sample compares with the census, so you also ask the workers the same questions about work that are asked in the census. Suppose the mean travel time to work from the most recent census is 24.1 minutes, with a standard deviation of 4.5 minutes. Your sample of 102 US workers…arrow_forwardIn 2007, the United States experienced the biggest jump in food prices in 17 years (The Wall Street Journal, April 1, 2008). A variety of reasons led to this result, including rising demand for meat and dairy products in emerging overseas markets, increased use of grains for alternative fuels, and bad weather in some parts of the world. A survey compared prices (in $) of selected products at grocery stores in the Boston area. The accompanying table shows the results. Item Crosby’s Shaw’s Market Basket Two-liter Coke 1.79 1.59 1.50 Doritos chips 4.29 4.99 3.50 Cheerios cereal 3.69 2.99 3.00 Prince spaghetti 1.59 1.69 1.99 Skippy peanut butter 5.49 4.49 3.99 Cracker Barrel cheese 4.99 4.99 3.49 Pepperidge Farm white bread 3.99 3.99 3.99 Oreo cookies 4.69 3.39 3.00 One dozen eggs* 2.49 2.69 1.59 Coffee* 4.49 4.79 3.99 Gallon of milk* 3.69 3.19 1.59 In a report, use the sample information to…arrow_forward
 Glencoe Algebra 1, Student Edition, 9780079039897...AlgebraISBN:9780079039897Author:CarterPublisher:McGraw Hill
 Big Ideas Math A Bridge To Success Algebra 1: Stu...AlgebraISBN:9781680331141Author:HOUGHTON MIFFLIN HARCOURTPublisher:Houghton Mifflin Harcourt
 Holt Mcdougal Larson Pre-algebra: Student Edition...AlgebraISBN:9780547587776Author:HOLT MCDOUGALPublisher:HOLT MCDOUGAL