
An Introduction to Statistical Methods and Data Analysis
7th Edition
ISBN: 9781305269477
Author: R. Lyman Ott, Micheal T. Longnecker
Publisher: Cengage Learning
expand_more
expand_more
format_list_bulleted
Concept explainers
Videos
Textbook Question
Chapter 3.11, Problem 4E
The regulations of the board of health in a particular state specify that the fluoride level must not exceed 1.5 parts per million (ppm). The 25 measurements given here represent the fluoride levels for a sample of 25 days. Although fluoride levels are measured more than once per day, these data represent the early morning readings for the 25 days sampled.
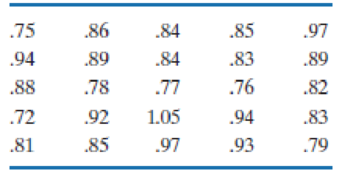
- a. Determine the
range of the measurements. - b. Dividing the range by 7, the number of subintervals selected, and rounding, we have a class interval width of .05. Using .705 as the lower limit of the first interval, construct a frequency histogram.
- c. Compute relative frequencies for each class interval and construct a relative frequency histogram. Note that the frequency and relative frequency histograms for these data have the same shape.
- d. If one of these 25 days were selected at random, what would be the chance (
probability ) that the fluoride reading would be greater than .90 ppm? Guess (predict) what proportion of days in the coming year will have a fluoride reading greater than .90 ppm.
Expert Solution & Answer

Trending nowThis is a popular solution!

Students have asked these similar questions
Radon is a gas emitted from the ground that can collect in houses in buildings. At certain levels it can cause lung cancer. Radon concentrations are measured in picocuries per liter (pCi/L). A radon level of 4 pCi/L is considered “acceptable” Radon levels in a house vary from week to week. In one house, a sample of 6 weeks had the following readings for radon level (in pCi/L):
1.9 2.8 3.9 3.9 4.2 5.7
Find the variance and standard deviation (definitional formula). Show your work using a table.
For each of the questions 1-4, answer the following (a-h are steps in a Hypothesis Test, see page 376 of your ebook). For steps f and g do both the p-value
method and the critical value method:
a) Claim in English:
b) Claim in Symbolic Form:
c) Null and Alternate Hypothesis:
d) Significance Level:
e) Test Statistic:
f) Find Values:
g) Make a Decision:
h) Restate the Decision in Nontechnical Terms:
i) If this is a statistically significant result, is it also a practically significant result?
Measurements are to be taken on each of the following characteristics. In each case,
indicate whether the resulting measurements would be classified as variables or
attributes data.
1. The number of flaws per square foot in a large sheet of metal.
2. The concentration of a chemical solution used in an electroplating process.
3. The time between breakdowns of a certain machine
4. The proportion of bolts in a batch that have oversize thread diameters
5. The thread diameter of a bolt
Chapter 3 Solutions
An Introduction to Statistical Methods and Data Analysis
Ch. 3.11 - The U.S. government spent more than $3.6 trillion...Ch. 3.11 - The type of vehicle the U.S public purchases...Ch. 3.11 - It has been reported that there has been a change...Ch. 3.11 - The regulations of the board of health in a...Ch. 3.11 - The National Highway Traffic Safety Administration...Ch. 3.11 - Prob. 6ECh. 3.11 - The survival times (in months) for two treatments...Ch. 3.11 - Combine the data from the separate therapies in...Ch. 3.11 - Prob. 9ECh. 3.11 - The following table presents homeownership rates,...
Ch. 3.11 - Prob. 11ECh. 3.11 - Prob. 12ECh. 3.11 - A supplier of high-quality audio equipment for...Ch. 3.11 - Prob. 14ECh. 3.11 - Compute the mean, median, and mode for the...Ch. 3.11 - Prob. 16ECh. 3.11 - Prob. 17ECh. 3.11 - Prob. 18ECh. 3.11 - A study of the reliability of buses [Large Sample...Ch. 3.11 - Prob. 20ECh. 3.11 - Prob. 21ECh. 3.11 - A study of the survival times, in days, of skin...Ch. 3.11 - Prob. 23ECh. 3.11 - Prob. 24ECh. 3.11 -
Refer to Exercise 3.24. Average the three group...Ch. 3.11 -
Pushing economy and wheelchair-propulsion...Ch. 3.11 - Prob. 27ECh. 3.11 - Prob. 28ECh. 3.11 -
The treatment times (in minutes) for patients at...Ch. 3.11 - To assist in estimating the amount of lumber in a...Ch. 3.11 -
Consumer Reports in its June 1998 issue reports...Ch. 3.11 - Many marine phanerogam species are highly...Ch. 3.11 - Prob. 33ECh. 3.11 - The following data are the resting pulse rates for...Ch. 3.11 - Consumer Reports in its May 1998 issue provides...Ch. 3.11 - Prob. 36ECh. 3.11 - Prob. 37ECh. 3.11 - Prob. 38ECh. 3.11 - In the paper “Demographic Implications of...Ch. 3.11 - Prob. 40ECh. 3.11 - Prob. 41ECh. 3.11 - Prob. 42ECh. 3.11 - Prob. 43SECh. 3.11 - Prob. 44SECh. 3.11 - Prob. 45SECh. 3.11 - Prob. 46SECh. 3.11 - Prob. 47SECh. 3.11 - Prob. 48SECh. 3.11 - A random sample of 90 standard metropolitan...Ch. 3.11 - Prob. 50SECh. 3.11 - Prob. 51SECh. 3.11 - Prob. 52SECh. 3.11 - Prob. 53SECh. 3.11 - The Insurance Institute for Highway Safety...Ch. 3.11 - Prob. 55SECh. 3.11 - Prob. 56SECh. 3.11 -
Federal authorities have destroyed considerable...Ch. 3.11 - The most widely reported index of the performance...Ch. 3.11 - As one part of a review of middle-manager...Ch. 3.11 - Prob. 60SECh. 3.11 - Prob. 61SECh. 3.11 - Prob. 62SECh. 3.11 - The correlations computed for the six variables in...Ch. 3.11 - Prob. 64SECh. 3.11 - Prob. 65SECh. 3.11 - Prob. 66SECh. 3.11 - Prob. 67SECh. 3.11 - Prob. 68SECh. 3.11 - Prob. 69SECh. 3.11 - Prob. 70SECh. 3.11 - Prob. 71SECh. 3.11 -
Refer to the data in Exercise 3.69.
Construct a...Ch. 3.11 - Prob. 73SECh. 3.11 - Prob. 74SECh. 3.11 - Prob. 75SECh. 3.11 - Prob. 76SECh. 3.11 - Prob. 77SECh. 3.11 - Prob. 78SECh. 3.11 - Prob. 79SECh. 3.11 - Prob. 80SE
Knowledge Booster


Learn more about
Need a deep-dive on the concept behind this application? Look no further. Learn more about this topic, statistics and related others by exploring similar questions and additional content below.Similar questions
- Read the setting of the metric vernier micrometer scale graduated in Figure 41-1 in 0.001marrow_forward1. Some chemical reaction is being run inside a sealed gas cylinder. During the reaction, a gaseous product is formed. The pressure P exerted by the gas has been measured five times. A gauge calibrated in units of psig was used. Data from the measurements are provided below: Table 1. Pressure measurements of the oxygen generated by chemical reaction inside a gas cylinder. P (psig) 21.0 Run # 1 2 3 4 5 20.2 20.7 21.3 20.5 a. Estimate the Type A uncertainty in these measurements. Be sure to include the units. b. Estimate the Type B uncertainty associated with these measurements. Be sure to include units. C. Determine the uncertainty in the measurement of pressure in the cylinder. Be sure to include units. State your ar we as average +/- uncertainty.arrow_forwardb. The concentration of the hydrogen ion in a sample of acid rain known to kill fish is 3.2. 10-5 mole per liter. Find the pH of this acid rain to the nearest tenth.arrow_forward
- a.In an aquaculture study the following variables were measured on each fish: sex. Initial weight (g), bodytemperature (C), weight gain (g). For each variable indicate the scale of measurement. (b) A weed killer is to be applied at a rate of two ounces per 1000gallons of water (2oz/1000gallons). What is the application rate in ml/1000litrtrs if there are 28.375 ml/oz and 4.5liters/gallon? (c) The term test scores of 15 students enrolled in a Business statistics class were recorded inascending order as follows 4, 7, 7, 9, 10, 11, 13, 15, 15, 15, 17, 17, 19, 19, 20. After calculatingthe mean, median and the mode an error is discovered: one of the 15’s is really a 17. Of the threemeasures of central tendency which will change? (d) A student discovers that his grade on a recent test was the 72 nd percentile. If 90 students wrotethe test, then approximately how many students received a higher grade than he did?arrow_forward19. In AGHJ, GH=8, HJ= 10, and mZG= 120. To the nearest tenth, what is %3D %3D mZJ?arrow_forwardCalcium is essential to tree growth because it promotes the formation of wood and maintains cell walls. In 1990, the concentration of calcium in precipitation in a certain area was 0.15 milligrams per liter (mg/L). A random sample of 10 precipitation dates in 2007 results in the following data table. Complete parts (a) through (c) below. Click the icon to view the data table. (a) State the hypotheses for determining if the mean concentration of calcium precipitation has changed since 1990. Но Ho: 0.15 mg/L H1: 0.15 mg/L i Data Table (b) Construct a 95% confidence interval about the sample mean concentration of calcium precipitation. The lower bound is The upper bound is (Round to four decimal places as needed.) 0.237 0.067 0.224 0.126 0.081 0.131 0.075 0.171 0.314 0.091 (c) Does the sample evidence suggest that calcium concentrations have changed since 1990? Print Done A. Yes, because the confidence interval does not contain 0.15 mg/L. B. Yes, because the confidence interval contains…arrow_forward
- Penicillin is produced by the Penicillium fungus, which is grown in a broth whose sugar content must be carefully controlled. Several samples of broth were taken on three successive days, and the amount of dissolved sugars, in milligrams per milliliter, was measured on each sample. The results were as follows. Day 1 : 5.2 5.5 5.1 4.9 5.3 5.0 5.2 5.1 5.4 5.2 4.8 5.1 5.4 Day 2 : 5.8 5.1 5.3 5.5 5.2 4.9 5.4 5.0 5.4 5.0 5.6 5.4 5.6 Day 3 : 5.9 4.9 5.2 5.3 5.1 5.4 5.3 5.8 5.5 5.4 5.4 5.4 5.2 Can you conclude that the mean sugar concentration differs among the three days? Use the =α0.05 level of significance and the ANOVA table shown below. One-way ANOVA: Sugar Concentration Source DF SS MS F P Days 2 0.2851 0.1426 2.3135 0.1134 Error 36 2.2185 0.0616…arrow_forwardPeriodically, the county Water Department tests the drinking water of homeowners for contaminants such as lead and copper. The lead and copper levels in water specimens collected in 1998 for a sample of 10 residents of a subdevelopement of the county are shown below. lead (g/L) copper (mg/L) 2.9 0.2 5.1 4.2 5.5 1.2 0.3 1.3 4.9 1.7 0.133 0.774 0.214 0.671 0.444 0.234 0.357 0.761 0.176 0.888 (a) Construct a 99% confidence interval for the mean lead level in water specimans of the subdevelopment. OSASO (b) Construct a 99% confidence interval for the mean copper level in water specimans of the subdevelopment. ≤H≤arrow_forward1. Can balloons hold more air or more water before bursting? A student purchased a large bag of 12-inch balloons. He randomly selected 10 balloons from the bag and then randomly assigned half of them to be filled with air until bursting and the other half to be filled with water until bursting. He used devices to measure the amount of air and water was dispensed until the balloons burst. Here's the data: Air (ft') Water (ft) 0.52 0.44 0.58 0.41 0.50 0.55 0.46 0.61 0.38 0.45 Does the data give convincing evidence air filled balloons can attain a greater volume than water filled balloons?arrow_forward
- Murder was committed in an air-conditioned laboratory. Dr. Quincy, the medical examiner, was summoned to the scene of the crime. One of the first things he did was to take the temperature of the corpse. At 9:23 PM, he recorded the temperature to be 20.1oC and at 9:53 Pm to be 18.7oC. He further observed that the thermostat of the air-conditioning unit was set at 16oC. After gathering all pertinent data and analyzing them for sometime, he submitted a preliminary report stating that the victim was murdered between 7 PM and 8 PM. Was Dr. Quincy's report correct? At what approximate time did the victim die? Assume that the normal body temperature of a human being, alive and well, is 37oC.arrow_forwardFind mZG. I 5/3 mZG = Submit % Warrow_forwardCompute for the standard elemental time using the given data: Actual Time = 10.5 sec, Performance Rating = 1.05, Fatigue Allowance = 15% Select one: a. None of the Above O b. 10.12 Sec O c. 1.65 sec O d. 12.68 sec O e. 9.59 secarrow_forward
arrow_back_ios
SEE MORE QUESTIONS
arrow_forward_ios
Recommended textbooks for you
 Glencoe Algebra 1, Student Edition, 9780079039897...AlgebraISBN:9780079039897Author:CarterPublisher:McGraw Hill
 Mathematics For Machine TechnologyAdvanced MathISBN:9781337798310Author:Peterson, John.Publisher:Cengage Learning,
 College AlgebraAlgebraISBN:9781305115545Author:James Stewart, Lothar Redlin, Saleem WatsonPublisher:Cengage Learning
Glencoe Algebra 1, Student Edition, 9780079039897...
Algebra
ISBN:9780079039897
Author:Carter
Publisher:McGraw Hill
Mathematics For Machine Technology
Advanced Math
ISBN:9781337798310
Author:Peterson, John.
Publisher:Cengage Learning,
College Algebra
Algebra
ISBN:9781305115545
Author:James Stewart, Lothar Redlin, Saleem Watson
Publisher:Cengage Learning
Which is the best chart: Selecting among 14 types of charts Part II; Author: 365 Data Science;https://www.youtube.com/watch?v=qGaIB-bRn-A;License: Standard YouTube License, CC-BY