
An Introduction to Statistical Methods and Data Analysis
7th Edition
ISBN: 9781305269477
Author: R. Lyman Ott, Micheal T. Longnecker
Publisher: Cengage Learning
expand_more
expand_more
format_list_bulleted
Videos
Textbook Question
Chapter 3.11, Problem 39E
In the paper “Demographic Implications of Socioeconomic Transition Among the Tribal Populations of Manipur, India’’ [Human Biology (1998) 70(3):597–619], the authors describe the tremendous changes that have taken place in all the tribal populations of Manipur, India, since the beginning of the twentieth century. The tribal populations of Manipur are in the process of socioeconomic transition from a traditional subsistence economy to a market-oriented economy. The following table displays the relation between literacy level and subsistence group for a sample of 614 married men and women in Manipur, India.
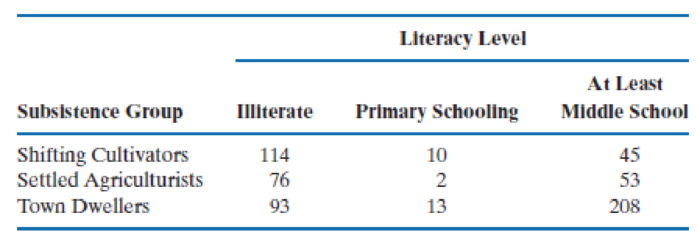
- a. Graphically depict the data in the table using a stacked bar graph.
- b. Do a percentage comparison based on the row and column totals. What conclusions do you reach with respect to the relation between literacy and subsistence group?
Expert Solution & Answer
Want to see the full answer?
Check out a sample textbook solution
Students have asked these similar questions
8. Entomological engineers are continually searching for new biological agents to
control one of the world's worst aquatic weeds, the water hyacinth. An insect that
naturally feeds on water hyacinth is the delphacid. Female delphacids lay anywhere
from one to four eggs onto a water hyacinth blade. The Annals of the Entomological
Society of America (Jan. 2005) published a study of the life cycle of a South American
delphacid species. The accompanying table gives the percentages of water hyacinth
blades that have one, two, three, and four delphacid eggs.
One Egg
Two Egg
Three Egg
Four Egg
Percentage of
Blades
40
54
2
4
Source: Sosa, A. J., et al. “Life history of Megamelus scutellaris with description of immature stages,"
Annals of the Entomological Society of America, Vol. 98, No. 1, Jan. 2005 (adapted from Table 1).
a) One of the water hyacinth blades in the study is randomly selected and Y, the
number of delphacid eggs on the blade, is observed. Give the probability
distribution of Y.…
Water scarcity has traditionally been a major concern in the Canary Islands. Water rights are
divided into shares, which are privately owned. The article "The Social Construction of
Scarcity. The Case of Water in Tenerife (Canary Islands)" (F. Aguilera-Klink, E. Perez-
Moriana, and J. Sanchez-Garcia, Ecological Economics, 2000:233-245) discusses the
extent to which many of the shares are concentrated among a few owners. The following
table presents the number of owners who own various numbers of shares. (There were 15
owners who owned 50 shares or more; these are omitted.) Note that it is possīble to own a
fractional number of shares; for example, the interval 2 3 contains 112 individuals who
owned at least 2 but less than 3 shares.
Number of Shares
Number of Owners
18
1-<2
165
2-<3
112
3-<4
87
4<5
43
5-< 10
10-< 15
117
51
15-< 20
32
20-< 25
10
25-< 30
30-< 50
Construct a histogram for these data.
Approximate the median mumber of shares owned by finding the point for which the
areas on…
A recent report by PEW Research Center, published on February 25, 2022 summarizes American views on Russia threat as follows. “When it comes to rising U.S.- Russia tensions, an early January survey found that 26% of Americans considered the Russian military buildup near Ukraine to be a major threat to U.S. interests, while 33% said it was a minor threat to U.S. interests. Another 7% said it was no threat at all. A relatively large share of U.S. adults (33%) said they were not sure how Russian actions toward Ukraine affected U.S. interests.” Answer the questions based on the proportions listed above.
(a) Use the binomial distribution to estimate the probability that more than half of 20 randomly selected US adults consider Russian military buildup near Ukraine to be a major or a minor threat to U.S. interests.
(b) Use the normal approximation to estimate the probability that more than half of 20 randomly selected US adults consider Russian military buildup near Ukraine to be a major or…
Chapter 3 Solutions
An Introduction to Statistical Methods and Data Analysis
Ch. 3.11 - The U.S. government spent more than $3.6 trillion...Ch. 3.11 - The type of vehicle the U.S public purchases...Ch. 3.11 - It has been reported that there has been a change...Ch. 3.11 - The regulations of the board of health in a...Ch. 3.11 - The National Highway Traffic Safety Administration...Ch. 3.11 - Prob. 6ECh. 3.11 - The survival times (in months) for two treatments...Ch. 3.11 - Combine the data from the separate therapies in...Ch. 3.11 - Prob. 9ECh. 3.11 - The following table presents homeownership rates,...
Ch. 3.11 - Prob. 11ECh. 3.11 - Prob. 12ECh. 3.11 - A supplier of high-quality audio equipment for...Ch. 3.11 - Prob. 14ECh. 3.11 - Compute the mean, median, and mode for the...Ch. 3.11 - Prob. 16ECh. 3.11 - Prob. 17ECh. 3.11 - Prob. 18ECh. 3.11 - A study of the reliability of buses [Large Sample...Ch. 3.11 - Prob. 20ECh. 3.11 - Prob. 21ECh. 3.11 - A study of the survival times, in days, of skin...Ch. 3.11 - Prob. 23ECh. 3.11 - Prob. 24ECh. 3.11 -
Refer to Exercise 3.24. Average the three group...Ch. 3.11 -
Pushing economy and wheelchair-propulsion...Ch. 3.11 - Prob. 27ECh. 3.11 - Prob. 28ECh. 3.11 -
The treatment times (in minutes) for patients at...Ch. 3.11 - To assist in estimating the amount of lumber in a...Ch. 3.11 -
Consumer Reports in its June 1998 issue reports...Ch. 3.11 - Many marine phanerogam species are highly...Ch. 3.11 - Prob. 33ECh. 3.11 - The following data are the resting pulse rates for...Ch. 3.11 - Consumer Reports in its May 1998 issue provides...Ch. 3.11 - Prob. 36ECh. 3.11 - Prob. 37ECh. 3.11 - Prob. 38ECh. 3.11 - In the paper “Demographic Implications of...Ch. 3.11 - Prob. 40ECh. 3.11 - Prob. 41ECh. 3.11 - Prob. 42ECh. 3.11 - Prob. 43SECh. 3.11 - Prob. 44SECh. 3.11 - Prob. 45SECh. 3.11 - Prob. 46SECh. 3.11 - Prob. 47SECh. 3.11 - Prob. 48SECh. 3.11 - A random sample of 90 standard metropolitan...Ch. 3.11 - Prob. 50SECh. 3.11 - Prob. 51SECh. 3.11 - Prob. 52SECh. 3.11 - Prob. 53SECh. 3.11 - The Insurance Institute for Highway Safety...Ch. 3.11 - Prob. 55SECh. 3.11 - Prob. 56SECh. 3.11 -
Federal authorities have destroyed considerable...Ch. 3.11 - The most widely reported index of the performance...Ch. 3.11 - As one part of a review of middle-manager...Ch. 3.11 - Prob. 60SECh. 3.11 - Prob. 61SECh. 3.11 - Prob. 62SECh. 3.11 - The correlations computed for the six variables in...Ch. 3.11 - Prob. 64SECh. 3.11 - Prob. 65SECh. 3.11 - Prob. 66SECh. 3.11 - Prob. 67SECh. 3.11 - Prob. 68SECh. 3.11 - Prob. 69SECh. 3.11 - Prob. 70SECh. 3.11 - Prob. 71SECh. 3.11 -
Refer to the data in Exercise 3.69.
Construct a...Ch. 3.11 - Prob. 73SECh. 3.11 - Prob. 74SECh. 3.11 - Prob. 75SECh. 3.11 - Prob. 76SECh. 3.11 - Prob. 77SECh. 3.11 - Prob. 78SECh. 3.11 - Prob. 79SECh. 3.11 - Prob. 80SE
Knowledge Booster


Learn more about
Need a deep-dive on the concept behind this application? Look no further. Learn more about this topic, statistics and related others by exploring similar questions and additional content below.Similar questions
- From a 2019 article in the Journal of Nutrients, the following abstract was obtained: The Mediterranean diet is considered one of the most worldwide healthy dietary patterns thanks to a combination of foods rich mainly in antioxidants and anti-inflammatory nutrients Many studies have demonstrated a strong and inverse relationship between a high level of Mediterranean diet adherence and some chronic discases (such as cardiovascular diseases diabetes, etc.) and cancer. Given its protective effects in reducing oxidative and inflammatory processes of cells and avoiding DNA damages, cell proliferation, and their survival. angiogenesis, inflammations and metastasis, the Mediterrancan diet is considered a powerful and manageable method to fight cancer incidence. The aim of this narrative review was to determine the magnitude of interaction between the Mediterrancan diet and more widespread types of cancer so as to give a first and useful overview on this relationship identifying. with a…arrow_forward2.8 Poverty and language. The American Community Survey is an ongoing survey that provides data every year to give communities the current information they need to plan investments and services. The 2010 American Community Survey estimates that 14.6% of Americans live below the poverty line, 20.7% speak a language other than English (foreign language) at home, and 4.2% fall into both categories.59 (a) Are living below the poverty line and speaking a foreign language at home disjoint? (b) Draw a Venn diagram summarizing the variables and their associated probabilities. (c) What percent of Americans live below the poverty line and only speak English at home? (d) What percent of Americans live below the poverty line or speak a foreign language at home? (e) What percent of Americans live above the poverty line and only speak English at home? (f) Is the event that someone lives below the poverty line independent of the event that the person speaks a foreign language at home?arrow_forwardSnowGoose Nests. In the article “Trophic Interaction Cycles in Tundra Ecosystems and the Impact of Climate Change” (Bio- Science, Vol. 55, No. 4, pp. 311–321), R. Ims and E. Fuglei provided an overview of animal species in the northern tundra. One threat to the snow goose in arctic Canada is the lemming. Snowy owls act as protection to the snow goose breeding grounds. For two years that are 3 years apart, the following graphs give relative frequency histograms of the distances, in meters, of snow goose nests to the nearest snowy owl nest. For each histogram, do the following: a. Identify the shape of the distribution with regard to modality. b. Identify the shape of the distribution with regard to symmetry (or nonsymmetry). c. If the distribution is unimodal and nonsymmetric, classify it as either right skewed or left skewed. d. Compare the two distributions.arrow_forward
- Consider the following scenario: A researcher is studying if an individual’s employment status (employed or unemployed) is predicted by the individual's number of years of education. Which "role-type classification" is represented in this scenario?arrow_forwardZane is examining two studies involving how different generations classify specified items as either luxuries or necessities. In the first study, generation A is defined to be people ages 18–29. The second study defined generation A to be people ages 22–33. Zane notices that the first study was conducted in 2002 while the second one was conducted in 2006 (a) According to the 2002 study, what are the birth years of generation A? The Sand Canyon Archaeological Project, edited by W. D. Lipe and published by Crow Canyon Archaeological Center, contains the stem-and-leaf diagram shown below. The study uses tree rings to accurately determine the year in which a tree was cut. The figure gives the tree-ring-cutting dates for samples of timbers found in the architectural units at Sand Canyon Pueblo. The text referring to the figure says, "The three-digit numbers in the left column represent centuries and decades A.D. The numbers to the right represent individual years, with each number derived…arrow_forward3. A study is conducted to evaluate risk factors for incident hypertension. All participants are free of hypertension at the start of the study and are followed for 4 years at which time they are re-assessed for hypertension. Risk factors are measured in all participants at the start of the study. A total of n-3182 participants enroll and 1123 develop hypertension over 4 years. The following table displays the numbers of participants who develop hvpertension bv gender and age group Develop Hypertension 255 241 496 Do Not Develop Hypertension 237 916 1153 Total Women Age 50+ Years Age 〈 50 years Total 492 1157 1649 Do Not Develop Hypertension 188 718 906 Total Develop Hypertension 283 344 627 Men Age 50+ Years Age 〈 50 Years Total 471 1062 1533 A. What is the relative risk for hypertension in women 50+ years versus women 〈 50 years of age? B. What is the relative risk for hypertension in men 50+ years versus men 〈 50 ears of age?arrow_forward
- An article in Urban Ecosystems, "Urbanization and Warming of Phoenix (Arizona, USA): Impacts, Feedbacks and Mitigation" (2002, Vol. 6, pp. 183-203), mentions that Phoenix is ideal to study the effects of an urban heat island because it has grown from a population of 300,000 to approximately 3 million over the last 50 years and this is a period with a continuous, detailed climate record. The 50-year averages of the mean annual temperatures at eight sites in Phoenix are shown below. Check the assumption of normality in the population with a probability plot. Construct a 90% confidence interval for the standard deviation over the sites of the mean annual temperatures. Site Sky Harbor Airport 23.3 Phoenix Greenway 21.7 Phoenix Encanto 21.6 Waddell Litchfield Laveen Average Mean Temperature (°C) Maricopa Harlquahala i 21.7 21.3 20.7 20.9 20.1 Round the answers to three decimal places. sosiarrow_forwardIn a 1996 article published in Technometrics, 38, pp. 11–22, the authors discuss the reliability of nuclear power plant emergency generators. To control the risk of damage to the nuclear core during accidents at nuclear plants, the reliability of emergency diesel generators (EDG) to start on demand must be maintained at a very high level. At each nuclear power plant there are a number of such generators. An overall measure of reliability is obtained by counting the number of times the EDGs successfully work when needed. The table here provides the number of successful demands for implementation of an EDG between each subsequent failure in an EDG for all the EDGs at each of seven nuclear power plants. A regulatory agency wants to determine if there is a difference in the reliability of the seven nuclear power plants. (Use Data _8). Do the conditions necessary for conducting the ANOVA test appear to be satisfied by these data?arrow_forward12. Western Pygmy-Possum. The foraging behavior of the west- ern pygmy-possum was investigated in the article “Strategies of a Small Nectarivorous Marsupial, the Western Pygmy-Possum, in Re- sponse to Seasonal Variation in Food Availability" (Journal of Mam- malogy, Vol. 96, No. 6, pp. 1525–1535) by D. Morrant and S. Petit. The weights of adult male pygmy-possums in Australia are normally distributed with a mean of 8.5 g and a standard deviation of 0.3 g. a. Sketch the normal curve for the pygmy-possum weights. b. Find the sampling distribution of the sample mean for samples of size 4. Draw a graph of the normal curve associated with ĩ. c. Repeat part (b) for samples of size 9.arrow_forward
- In a 1996 article published in Technometrics, 38, pp. 11–22, the authors discuss the reliability of nuclear power plant emergency generators. To control the risk of damage to the nuclear core during accidents at nuclear plants, the reliability of emergency diesel generators (EDG) to start on demand must be maintained at a very high level. At each nuclear power plant there are a number of such generators. An overall measure of reliability is obtained by counting the number of times the EDGs successfully work when needed. The table here provides the number of successful demands for implementation of an EDG between each subsequent failure in an EDG for all the EDGs at each of seven nuclear power plants. A regulatory agency wants to determine if there is a difference in the reliability of the seven nuclear power plants. (Use Data _8). Run an ANOVA (Regardless of the assumptions) and Kruskal–Wallis test.arrow_forwardIn a 1996 article published in Technometrics, 38, pp. 11–22, the authors discuss the reliability of nuclear power plant emergency generators. To control the risk of damage to the nuclear core during accidents at nuclear plants, the reliability of emergency diesel generators (EDG) to start on demand must be maintained at a very high level. At each nuclear power plant there are a number of such generators. An overall measure of reliability is obtained by counting the number of times the EDGs successfully work when needed. The table here provides the number of successful demands for implementation of an EDG between each subsequent failure in an EDG for all the EDGs at each of seven nuclear power plants. A regulatory agency wants to determine if there is a difference in the reliability of the seven nuclear power plants. (Use Data _8). Do the conditions necessary for conducting the ANOVA test appear to be satisfied by these data? Run an ANOVA (Regardless of the assumptions) and…arrow_forwardThe article "Estimating Population Abundance in Plant Species with Dormant Life-Stages: Fire and the Endangered Plant Grevillea caleye R Br." (T. Auld and J. Scott, Ecological Management and Restoration, 2004:125-129) presents estimates of population sizes of a certain rare shrub in areas burnt by fire. The following table presents population counts and areas (in m?) for several patches containing the plant. Агеа 3739 Population 3015 5277 1847 400 17 345 392 142 40 7000 2521 213 11958 1200 2878 707 113 1392 157 12000 10880 711 74 2259 223 81 15 33 18 1254 1320 229 351 1000 92 841 1720 1500 300 228 31 228 17 10 Compute the least-squares line for predicting population (y) from area (x). Б. a. Plot the residuals versus the fitted values. Does the model seem appropriate? Compute the least-squares line for predicting In y from In x. Plot the residuals versus the fitted values. Does the model seem appropriate? Using the more appropriate model, construct a 95% prediction interval for the…arrow_forward
arrow_back_ios
SEE MORE QUESTIONS
arrow_forward_ios
Recommended textbooks for you
 Calculus For The Life SciencesCalculusISBN:9780321964038Author:GREENWELL, Raymond N., RITCHEY, Nathan P., Lial, Margaret L.Publisher:Pearson Addison Wesley,
Calculus For The Life Sciences
Calculus
ISBN:9780321964038
Author:GREENWELL, Raymond N., RITCHEY, Nathan P., Lial, Margaret L.
Publisher:Pearson Addison Wesley,
Hypothesis Testing using Confidence Interval Approach; Author: BUM2413 Applied Statistics UMP;https://www.youtube.com/watch?v=Hq1l3e9pLyY;License: Standard YouTube License, CC-BY
Hypothesis Testing - Difference of Two Means - Student's -Distribution & Normal Distribution; Author: The Organic Chemistry Tutor;https://www.youtube.com/watch?v=UcZwyzwWU7o;License: Standard Youtube License