
An Introduction to Statistical Methods and Data Analysis
7th Edition
ISBN: 9781305269477
Author: R. Lyman Ott, Micheal T. Longnecker
Publisher: Cengage Learning
expand_more
expand_more
format_list_bulleted
Videos
Textbook Question
Chapter 3.11, Problem 10E
The following table presents homeownership rates, in percentages, by state for the years 1985, 1996, and 2002. These values represent the proportion of homes owned by the occupant to the total number of occupied homes.
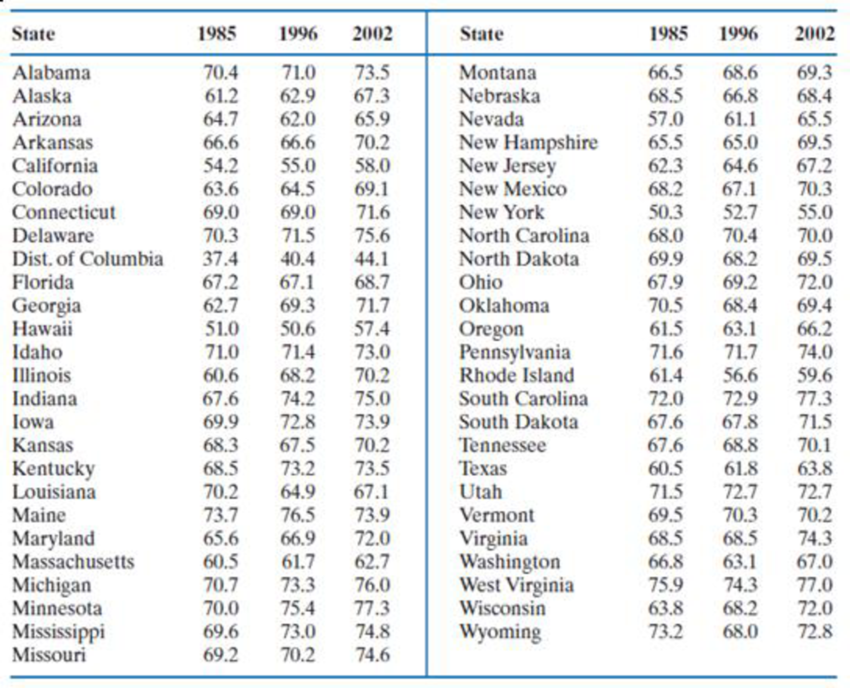
- a. Construct relative frequency histogram plots for the homeownership data given in the table for the years 1985, 1996, and 2002.
- b. What major differences exist among the plots for the three years?
- c. Why do you think the plots have changed over these 17 years?
- d. How could Congress use the information in these plots for writing tax laws that allow major tax deductions for homeownership?
Expert Solution & Answer
Want to see the full answer?
Check out a sample textbook solution
Chapter 3 Solutions
An Introduction to Statistical Methods and Data Analysis
Ch. 3.11 - The U.S. government spent more than $3.6 trillion...Ch. 3.11 - The type of vehicle the U.S public purchases...Ch. 3.11 - It has been reported that there has been a change...Ch. 3.11 - The regulations of the board of health in a...Ch. 3.11 - The National Highway Traffic Safety Administration...Ch. 3.11 - Prob. 6ECh. 3.11 - The survival times (in months) for two treatments...Ch. 3.11 - Combine the data from the separate therapies in...Ch. 3.11 - Prob. 9ECh. 3.11 - The following table presents homeownership rates,...
Ch. 3.11 - Prob. 11ECh. 3.11 - Prob. 12ECh. 3.11 - A supplier of high-quality audio equipment for...Ch. 3.11 - Prob. 14ECh. 3.11 - Compute the mean, median, and mode for the...Ch. 3.11 - Prob. 16ECh. 3.11 - Prob. 17ECh. 3.11 - Prob. 18ECh. 3.11 - A study of the reliability of buses [Large Sample...Ch. 3.11 - Prob. 20ECh. 3.11 - Prob. 21ECh. 3.11 - A study of the survival times, in days, of skin...Ch. 3.11 - Prob. 23ECh. 3.11 - Prob. 24ECh. 3.11 -
Refer to Exercise 3.24. Average the three group...Ch. 3.11 -
Pushing economy and wheelchair-propulsion...Ch. 3.11 - Prob. 27ECh. 3.11 - Prob. 28ECh. 3.11 -
The treatment times (in minutes) for patients at...Ch. 3.11 - To assist in estimating the amount of lumber in a...Ch. 3.11 -
Consumer Reports in its June 1998 issue reports...Ch. 3.11 - Many marine phanerogam species are highly...Ch. 3.11 - Prob. 33ECh. 3.11 - The following data are the resting pulse rates for...Ch. 3.11 - Consumer Reports in its May 1998 issue provides...Ch. 3.11 - Prob. 36ECh. 3.11 - Prob. 37ECh. 3.11 - Prob. 38ECh. 3.11 - In the paper “Demographic Implications of...Ch. 3.11 - Prob. 40ECh. 3.11 - Prob. 41ECh. 3.11 - Prob. 42ECh. 3.11 - Prob. 43SECh. 3.11 - Prob. 44SECh. 3.11 - Prob. 45SECh. 3.11 - Prob. 46SECh. 3.11 - Prob. 47SECh. 3.11 - Prob. 48SECh. 3.11 - A random sample of 90 standard metropolitan...Ch. 3.11 - Prob. 50SECh. 3.11 - Prob. 51SECh. 3.11 - Prob. 52SECh. 3.11 - Prob. 53SECh. 3.11 - The Insurance Institute for Highway Safety...Ch. 3.11 - Prob. 55SECh. 3.11 - Prob. 56SECh. 3.11 -
Federal authorities have destroyed considerable...Ch. 3.11 - The most widely reported index of the performance...Ch. 3.11 - As one part of a review of middle-manager...Ch. 3.11 - Prob. 60SECh. 3.11 - Prob. 61SECh. 3.11 - Prob. 62SECh. 3.11 - The correlations computed for the six variables in...Ch. 3.11 - Prob. 64SECh. 3.11 - Prob. 65SECh. 3.11 - Prob. 66SECh. 3.11 - Prob. 67SECh. 3.11 - Prob. 68SECh. 3.11 - Prob. 69SECh. 3.11 - Prob. 70SECh. 3.11 - Prob. 71SECh. 3.11 -
Refer to the data in Exercise 3.69.
Construct a...Ch. 3.11 - Prob. 73SECh. 3.11 - Prob. 74SECh. 3.11 - Prob. 75SECh. 3.11 - Prob. 76SECh. 3.11 - Prob. 77SECh. 3.11 - Prob. 78SECh. 3.11 - Prob. 79SECh. 3.11 - Prob. 80SE
Knowledge Booster


Learn more about
Need a deep-dive on the concept behind this application? Look no further. Learn more about this topic, statistics and related others by exploring similar questions and additional content below.Recommended textbooks for you
 Glencoe Algebra 1, Student Edition, 9780079039897...AlgebraISBN:9780079039897Author:CarterPublisher:McGraw Hill
 Holt Mcdougal Larson Pre-algebra: Student Edition...AlgebraISBN:9780547587776Author:HOLT MCDOUGALPublisher:HOLT MCDOUGAL
 Big Ideas Math A Bridge To Success Algebra 1: Stu...AlgebraISBN:9781680331141Author:HOUGHTON MIFFLIN HARCOURTPublisher:Houghton Mifflin Harcourt
 Functions and Change: A Modeling Approach to Coll...AlgebraISBN:9781337111348Author:Bruce Crauder, Benny Evans, Alan NoellPublisher:Cengage Learning
Glencoe Algebra 1, Student Edition, 9780079039897...
Algebra
ISBN:9780079039897
Author:Carter
Publisher:McGraw Hill
Holt Mcdougal Larson Pre-algebra: Student Edition...
Algebra
ISBN:9780547587776
Author:HOLT MCDOUGAL
Publisher:HOLT MCDOUGAL
Big Ideas Math A Bridge To Success Algebra 1: Stu...
Algebra
ISBN:9781680331141
Author:HOUGHTON MIFFLIN HARCOURT
Publisher:Houghton Mifflin Harcourt
Functions and Change: A Modeling Approach to Coll...
Algebra
ISBN:9781337111348
Author:Bruce Crauder, Benny Evans, Alan Noell
Publisher:Cengage Learning
How to make Frequency Distribution Table / Tally Marks and Frequency Distribution Table; Author: Reenu Math;https://www.youtube.com/watch?v=i_A6RiE8tLE;License: Standard YouTube License, CC-BY
Frequency distribution table in statistics; Author: Math and Science;https://www.youtube.com/watch?v=T7KYO76DoOE;License: Standard YouTube License, CC-BY
Frequency Distribution Table for Grouped/Continuous data | Math Dot Com; Author: Maths dotcom;https://www.youtube.com/watch?v=ErnccbXQOPY;License: Standard Youtube License