
Videos
Scattergraph Method
Refer to the information for Luisa Crimini above.
Required:
CONCEPTUAL CONNECTION Prepare a scattergraph based on Luisa’s data. Use monthly cost for the vertical axis and number of appointments for the horizontal axis. Based on an examination of the scattergraph, does there appear to be a linear relationship between the cost of tanning services and the number of appointments?
Use the following information for Exercises 3-44 through 3-46:
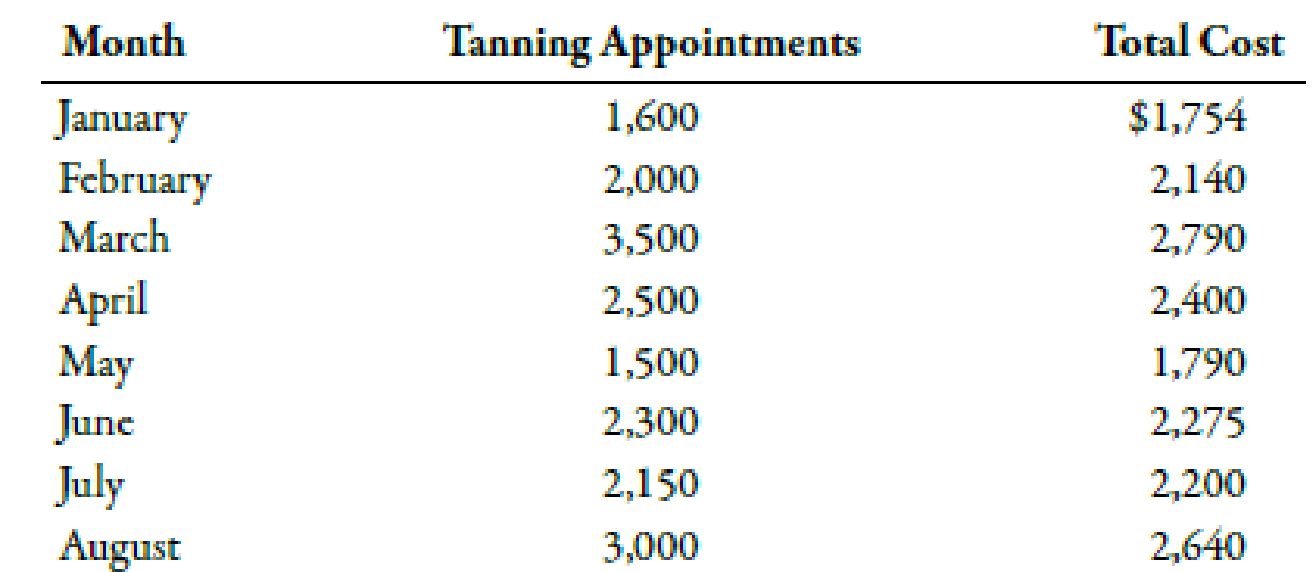
Luisa Crimini has been operating a beauty shop in a college town for the past 10 years. Recently, Luisa rented space next to her shop and opened a tanning salon. She anticipated that the costs for the tanning service would primarily be fixed, but found that tanning salon costs increased with the number of appointments. Costs for this service over the past 8 months are as follows:

Trending nowThis is a popular solution!

Chapter 3 Solutions
Managerial Accounting: The Cornerstone of Business Decision-Making


- Method of Least Squares Refer to the information for Luisa Crimini on the previous page. Required: 1. Using a computer spreadsheet program such as Excel, run a regression on these data. Based on the regression output, write the cost formula for tanning. (Note: Round the fixed cost to the nearest dollar and the variable rate to the nearest cent.) 2. Using the formula computed in Requirement 1, what is the predicted cost of tanning services for September for 2,500 appointments? Use the following information for Exercises 3-44 through 3-46: Luisa Crimini has been operating a beauty shop in a college town for the past 10 years. Recently, Luisa rented space next to her shop and opened a tanning salon. She anticipated that the costs for the tanning service would primarily be fixed, but found that tanning salon costs increased with the number of appointments. Costs for this service over the past 8 months are as follows:arrow_forwardLinear cost approximation. Dr. Young, of Young and Associates, LLP, is examining how overhead costs behave as a function of monthly physician contact hours billed to patients. The historical data are as follows:arrow_forwardWhich of the following will give you the most accurate allocation between a cost's fixed component and variable component? a. Examination of a students’ registration forms for miscellaneous fees and tuition fees b. Use of the least squares method to allocate the cost of electricity c. Dividing the total cost on the water bill among the different departments based on direct labor hours d. Dividing the total cost of the postpaid plan using the high-low methodarrow_forward
- Classify each of the cost items as one of the business functions of the value chain in “Payment of booth registration fee at a medical conference to promote new products to physicians.”arrow_forwardCompute the linear cost function, relating total overhead costs to physician contact hours, using the representative observations of 200 and 300 hours. Plot the linear cost function. Does the constant component of the cost function represent the fixed overhead costs of Young and Associates? Why?arrow_forwardCheck image file for question Q1a. Allocate the service department costs to the two operating departments using the direct method. b.Allocate the service department cost to the two operating departments using ,I)the step-down method (Allocate administrative service first) . ii)the step down method (Allocoate Maintenance service first) c. Assuming you are the manager of the Daily Patient department.Discuss which method of cost allocation would you prefer.Justify your decision d.Mr Smith the financial controller of LabAid is convinced that the step-down method allocates more costs to the operating departments than the direct method.Do you agree with ,Mr Smith.Explain.arrow_forward
- Convert the accompanying database to an Excel table to find: a.The total cost of all orders. b.Thetotal quantity of airframe fasteners purchased. c. The total cost of all orders placed with Manley Valve. Question content area bottom Part 1 a. The total cost of all orders is $?????? enter your response here.arrow_forwardJohnson Filtration. Inc., provides maintenance service for water filtration systems throughout southern Florida. Customers contact Johnson with requests for maintenance service on their water filtration systems. To estimate the service time and the service cost. Johnson’s managers want to predict the repair time necessary for each maintenance request. Hence, repair time in hours is the dependent variable. Repair time is believed to be related to three factors: the number of months since the last maintenance service, the type of repair problem (mechanical or electrical), and the repairperson who performs the repair (Donna Newton or Bob Jones). Data for a sample of 10 service calls are reported in the following table: Develop the simple linear regression equation to predict repair time given the number of months since the last maintenance service, and use the results to test the hypothesis that no relationship exists between repair time and the number of months since the last maintenance service at the 0.05 level of significance. What is the interpretation of this relationship? What does the coefficient of determination tell you about this model? Using the simple linear regression model developed in part (a), calculate the predicted repair time and residual for each of the 10 repairs in the data. Sort the data in ascending order by value of the residual. Do you see any pattern in the residuals for the two types of repair? Do you see any pattern in the residuals for the two repairpersons? Do these results suggest any potential modifications to your simple linear regression model? Now create a scatter chart with months since last service on the x-axis and repair time in hours on the y-axis for which the points representing electrical and mechanical repairs are shown in different shapes and/or colors. Create a similar scatter chart of months since last service and repair time in hours for which the points representing repairs by Bob Jones and Donna Newton are shown in different shapes and/or colors. Do these charts and the results of your residual analysis suggest the same potential modifications to your simple linear regression model? Create a new dummy variable that is equal to zero if the type of repair is mechanical and one if the type of repair is electrical. Develop the multiple regression equation to predict repair time, given the number of months since the last maintenance service and the type of repair. What are the interpretations of the estimated regression parameters? What does the coefficient of determination tell you about this model? Create a new dummy variable that is equal to zero if the repairperson is Bob Jones and one if the repairperson is Donna Newton. Develop the multiple regression equation to predict repair time, given the number of months since the last maintenance service and the repairperson. What are the interpretations of the estimated regression parameters? What does the coefficient of determination tell you about this model? Develop the multiple regression equation to predict repair time, given the number of months since the last maintenance service, the type of repair, and the repairperson. What are the interpretations of the estimated regression parameters? What does the coefficient of determination tell you about this model? Which of these models would you use? Why?arrow_forwardA two-sample test for means was conducted to determine if the completion time for continuing education programs for nurses differed when costs are paid by employers (Yes) versus when individuals paid out of their own funds (No). The Excel Data Analysis tool results are provided. Complete parts a through c below Click the icon to view the Excel Data Analysis tool results. a. Explain how to use this information to draw a conclusion if the null hypothesis is Hoy - 50. Clearly state the correct cribcal value and p-value and your conclusion. The alternative hypothesis is H₁: The p-value is (Type an integer or a decimal rounded to Bree decimal places as needed.) Therefore, the null hypothesis. The data provide sufficient evidence to conclude that the mean completion time is Excel Data Analysis tool results t-Test Two-Sample Assuming Unequal VananDES Mean Variance Yes 34.081 445.045 No 28.601 348.065 for nurses when costs are paid by employers. Observations 12 8 Hypothesized Mean Difference 0…arrow_forward
- The total number of term life insurance contracts sold in Problem 13 is 199. The following pie chart shows the percentages of contracts sold by each salesperson. a. What are the problems with using a pie chart to display these data? b. What type of chart would be preferred for displaying the data in this pie chart? c. Use a different type of chart to display the percentage of contracts sold by each salesperson that conveys the data better than the pie chart. Format the chart and add data labels to improve the charts readability.arrow_forwardMementos Academy is assessing whether to outsource its student enrolment processes. The general process followed by staff in the enrolment office is to first validate students’ prior academic record (e.g., secondary school results) and send an offer of enrolment, provide degree advice and enter students’ study program details into the student record system, and collect fees. The following table shows the costs associated with these three processes: Cost Validation Student records Fees collection Staff salaries 70,400 43,900 39,700 Data processing 9,200 32,500 7,900 Telephone 1,700 4,600 3,000 Postage - 1,500 4,000 Consumables 3,700 45,900 11,800 Electricity 1,600 3,100 3,000 Equipment depreciation 12,200 35,800 31,900 Insurance…arrow_forwardThe Human Resources Manager for Optilytics LLC is evaluating applications for the position of Senior Data Scientist. The file OptilyticsLLC presents summary data of the applicants for the position. a. Use a PivotTable in Excel to create a joint probability table showing the probabilities associated with a randomly selected applicants sex and highest degree achieved. Use this joint probability table to answer the questions below. b. What are the marginal probabilities? What do they tell you about the probabilities associated with the sex of applicants and highest degree completed by applicants? c. If the applicant is female, what is the probability that the highest degree completed by the applicant is a PhD? d. If the highest degree completed by the applicant is a bachelors degree, what is the probability that the applicant is male? e. What is the probability that a randomly selected applicant will be a male whose highest completed degree is a PhD?arrow_forward
 Managerial Accounting: The Cornerstone of Busines...AccountingISBN:9781337115773Author:Maryanne M. Mowen, Don R. Hansen, Dan L. HeitgerPublisher:Cengage Learning
 Cornerstones of Cost Management (Cornerstones Ser...AccountingISBN:9781305970663Author:Don R. Hansen, Maryanne M. MowenPublisher:Cengage Learning
 Essentials of Business Analytics (MindTap Course ...StatisticsISBN:9781305627734Author:Jeffrey D. Camm, James J. Cochran, Michael J. Fry, Jeffrey W. Ohlmann, David R. AndersonPublisher:Cengage Learning
 Principles of Accounting Volume 2AccountingISBN:9781947172609Author:OpenStaxPublisher:OpenStax College
 Excel Applications for Accounting PrinciplesAccountingISBN:9781111581565Author:Gaylord N. SmithPublisher:Cengage Learning