
Managerial Accounting: The Cornerstone of Business Decision-Making
7th Edition
ISBN: 9781337115773
Author: Maryanne M. Mowen, Don R. Hansen, Dan L. Heitger
Publisher: Cengage Learning
expand_more
expand_more
format_list_bulleted
Videos
Textbook Question
Chapter 3, Problem 56E
(Appendix 3A) Method of Least Squares Using Computer Spreadsheet Program
Susan Lewis, owner of a florist shop, is interested in predicting the cost of delivering floral arrangements. She collected monthly data on the number of deliveries and the total monthly delivery cost (depreciation on the van, wages of the driver, and fuel) for the past year.
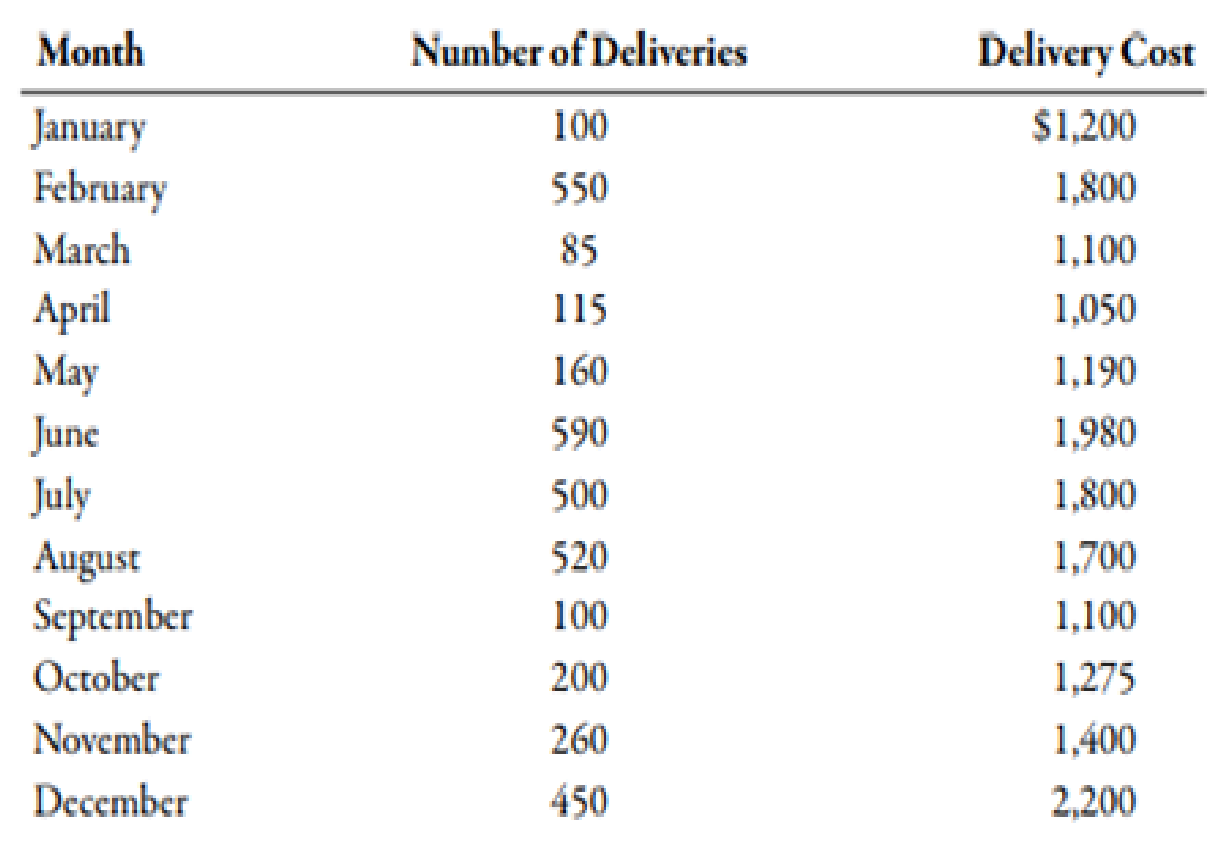
Required:
- 1. Using a computer spreadsheet program such as Excel, run a regression on these data. Print out your results.
- 2. Using your results from Requirement 1, write the cost formula for delivery cost. (Note: Round the fixed cost to the nearest dollar and the variable rate to the nearest cent.)
- 3. CONCEPTUAL CONNECTION What is R2 based on your results? Do you think that the number of direct labor hours is a good predictor of delivery cost?
- 4. Using the cost formula in Requirement 2, what would predicted delivery cost be for a month with 300 deliveries?
Expert Solution & Answer

Trending nowThis is a popular solution!

Students have asked these similar questions
Each Section should be completed in a separate spreadsheet tab and all calculations should be performed using Excel formulas:
You graduated from college and landed a new job that will start in a couple of weeks. You need to purchase a car to commute to and from your new place of employment. You have decided to buy a car that costs $40,000, and will make a $5,000 down payment, resulting in the need to take out a $35,000 loan with a 5% annual interest rate that you will pay off in equal monthly installments over the next 5 years (60 months). Calculate and provide the following information:
a) Calculate the monthly payment on the car loan.
b) Prepare an amortization table for the car loan that provides separate columns for the following for each month of the car loan: Beginning loan balance; total payment amount, amount of monthly payment allocated to interest; amount of monthly payment allocated to the principal balance; and ending loan balance. (Your amortization table is likely…
Use the assumptions below to create calculations to determine annual and monthly revenue projections for each of the categories. Be sure to make the revenue category on the pro-forma view (above) descriptive and use your assumptions as drivers for the values calculated. Make it easy to change the assumptions to determine the impact of a change (up or down) in volume, rates and discounts. Insert lines or columns as needed.
Camps and Schools require physicals before kids arrive. There are 150 camper physicals spread evenly in May and June. There are 500 school physicals, 25% in July, 65% in August, and 10% in September. The insurance companies in covering families in your community are split 50% BC/BS and 40% United Healthcare and no insurance (private pay). Your normal camper physical charge is $115. You give BC/BS an 18% discount and United Health care a 15% discount. The special promotion for campers without insurance (private pay) is $75.
Camper Physical
$ 115
Payor -…
1. An agent for a residential real estate company in a large city would like to be able to predict the monthly rental cost for apartments, based on the size of an apartment, as defined by square footage. The agent selects a sample of 25
apartments in a particular residential neighborhood and gathers the following data: (pic)
a. Construct a scatter plot.
b. Use the least-squares method to determine the regression
coefficients b0 and b1
Chapter 3 Solutions
Managerial Accounting: The Cornerstone of Business Decision-Making
Ch. 3 - Prob. 1DQCh. 3 - What is a driver? Give an example of a cost and...Ch. 3 - Suppose a company finds that shipping cost is...Ch. 3 - Some firms assign mixed costs to either the fixed...Ch. 3 - Explain the difference between committed and...Ch. 3 - Explain why the concept of relevant range is...Ch. 3 - Why do mixed costs pose a problem when it comes to...Ch. 3 - Describe the cost formula for a strictly fixed...Ch. 3 - Describe the cost formula for a strictly variable...Ch. 3 - What is the scattergraph method, and why is it...
Ch. 3 - Describe how the scattergraph method breaks out...Ch. 3 - What are the advantages of the scattergraph method...Ch. 3 - Prob. 13DQCh. 3 - What is meant by the best-fitting line?Ch. 3 - What is the difference between the unit cost of a...Ch. 3 - Prob. 16DQCh. 3 - (Appendix 3A) Explain the meaning of the...Ch. 3 - A factor that causes or leads to a change in a...Ch. 3 - Which of the following would probably be a...Ch. 3 - Prob. 3MCQCh. 3 - In the cost formula, the term 128,000,000 a. is...Ch. 3 - In the cost formula, the term 12,000 a. is the...Ch. 3 - Prob. 6MCQCh. 3 - Prob. 7MCQCh. 3 - The following cost formula for total purchasing...Ch. 3 - An advantage of the high-low method is that it a....Ch. 3 - Prob. 10MCQCh. 3 - Prob. 11MCQCh. 3 - Prob. 12MCQCh. 3 - The total cost for monthly supervisory cost in a...Ch. 3 - Yates Company shows the following unit costs for...Ch. 3 - (Appendix 3A) In the method of least squares, the...Ch. 3 - Creating and Using a Cost Formula Big Thumbs...Ch. 3 - Using High-Low to Calculate Fixed Cost, Calculate...Ch. 3 - Using High-Low to Calculate Predicted Total...Ch. 3 - Using High-Low to Calculate Predicted Total...Ch. 3 - Using Regression to Calculate Fixed Cost,...Ch. 3 - Inventory Valuation under Absorption Costing Refer...Ch. 3 - Inventory Valuation under Variable Costing Refer...Ch. 3 - Absorption-Costing Income Statement Refer to the...Ch. 3 - Variable-Costing Income Statement Refer to the...Ch. 3 - Creating and Using a Cost Formula Kleenaire Motors...Ch. 3 - Using High-Low to Calculate Fixed Cost, Calculate...Ch. 3 - Using High-Low to Calculate Predicted Total...Ch. 3 - Brief Exercise 3-28 Using High-Low to Calculate...Ch. 3 - Using Regression to Calculate Fixed Cost,...Ch. 3 - Inventory Valuation under Absorption Costing Refer...Ch. 3 - Inventory Valuation under Variable Costing Refer...Ch. 3 - Brief Exercise 3-32 Absorption-Costing Income...Ch. 3 - Brief Exercise 3-33 Variable-Costing Income...Ch. 3 - Variable and Fixed Costs What follows are a number...Ch. 3 - Cost Behavior, Classification Smith Concrete...Ch. 3 - Prob. 36ECh. 3 - Prob. 37ECh. 3 - Prob. 38ECh. 3 - Step Costs, Relevant Range Bellati Inc. produces...Ch. 3 - Matching Cost Behavior Descriptions to Cost...Ch. 3 - Examine the graphs in Exercise 3-40. Required: As...Ch. 3 - Prob. 42ECh. 3 - Prob. 43ECh. 3 - High-Low Method Refer to the information for Luisa...Ch. 3 - Scattergraph Method Refer to the information for...Ch. 3 - Method of Least Squares Refer to the information...Ch. 3 - Use the following information for Exercises 3-47...Ch. 3 - Use the following information for Exercises 3-47...Ch. 3 - Method of Least Squares, Developing and Using the...Ch. 3 - The method of least squares was used to develop a...Ch. 3 - Identifying the Parts of the Cost Formula;...Ch. 3 - Inventory Valuation under Absorption Costing...Ch. 3 - Inventory Valuation under Variable Costing Lane...Ch. 3 - Income Statements under Absorption and Variable...Ch. 3 - (Appendix 3A) Method of Least Squares Using...Ch. 3 - (Appendix 3A) Method of Least Squares Using...Ch. 3 - Identifying Fixed, Variable, Mixed, and Step Costs...Ch. 3 - Identifying Use of the High-Low, Scattergraph, and...Ch. 3 - Identifying Variable Costs, Committed Fixed Costs,...Ch. 3 - Scattergraph, High-Low Method, and Predicting Cost...Ch. 3 - Method of Least Squares, Predicting Cost for...Ch. 3 - Cost Behavior, High-Low Method, Pricing Decision...Ch. 3 - Prob. 63PCh. 3 - Variable and Fixed Costs, Cost Formula, High-Low...Ch. 3 - Cost Separation About 8 years ago, Kicker faced...Ch. 3 - Variable-Costing and Absorption-Costing Income...Ch. 3 - Refer to the information for Farnsworth Company...Ch. 3 - (Appendix 3A) Scattergraph, High-Low Method,...Ch. 3 - (Appendix 3A) Separating Fixed and Variable Costs,...Ch. 3 - (Appendix 3A) Cost Formulas, Single and Multiple...Ch. 3 - Suspicious Acquisition of Data, Ethical Issues...
Knowledge Booster


Learn more about
Need a deep-dive on the concept behind this application? Look no further. Learn more about this topic, accounting and related others by exploring similar questions and additional content below.Similar questions
- Method of Least Squares Refer to the information for Luisa Crimini on the previous page. Required: 1. Using a computer spreadsheet program such as Excel, run a regression on these data. Based on the regression output, write the cost formula for tanning. (Note: Round the fixed cost to the nearest dollar and the variable rate to the nearest cent.) 2. Using the formula computed in Requirement 1, what is the predicted cost of tanning services for September for 2,500 appointments? Use the following information for Exercises 3-44 through 3-46: Luisa Crimini has been operating a beauty shop in a college town for the past 10 years. Recently, Luisa rented space next to her shop and opened a tanning salon. She anticipated that the costs for the tanning service would primarily be fixed, but found that tanning salon costs increased with the number of appointments. Costs for this service over the past 8 months are as follows:arrow_forwardA marketing professor at Givens College is interested in the relationship between hours spent studying and total points earned in a course. Data collected on 156 students who took the course last semester are provided in the tile MktHrsPts. Develop a scatter chart for these data. What does the scatter chart indicate about the relationship between total points earned and hours spent studying? Develop an estimated regression equation showing how total points earned is related to hours spent studying. What is the estimated regression model? Test whether each of the regression parameters β0 and β1 is equal to zero at a 0.01 level of significance. What are the correct interpretations of the estimated regression parameters? Are these interpretations reasonable? How much of the variation in the sample values of total point earned does the model you estimated in part (b) explain? Mark Sweeney spent 95 hours studying. Use the regression model you estimated in part (b) to predict the total points Mark earned.arrow_forwardGive typing answer with explanation and conclusion 1. Discuss your reaction for the following mental accounting scenarios Question 3—Part A: Suppose that you've taken half a day off work to shop for a new, ride-on lawn mower. You have a big yard, and trimming it with your current, push-propelled mower simply takes too long. You have been eyeing the Model A300, which offers all the features you require at a cost of $2,000. As luck would have it, you won $500 the previous evening playing bingo at your local Rotary Club. When you arrive at the lawn mower shop, you notice that they also stock Model A305, which has some fancy, desirable new options. This premium model costs $2,250. Considering the previous night's winnings, will you indulge yourself by purchasing the A305? a. yes. b. no.arrow_forward
- Recent monthly costs of providing on-board flight service incurred by Great Plains Airlines are shown in the following table. Required:1. Build a spreadsheet: Construct an Excel spreadsheet and use the Excel commands to perform a least-squares regression. Estimate the cost behavior of the airline’s on-board flight service. Express the cost behavior in equation form.2. Use Excel to calculate and interpret the R2 value for the regression.arrow_forwardA sociologist was hired by a large city hospital to investigate the relationship between the number of unauthorized days that employees are absent per year and the distance (miles) between home and work for the employees. A sample of 10 employees was chosen, and the following data were collected. a. Develop a scatter chart for these data. Does a linear relationship appear reasonable? Explain. b. Use the data to develop an estimated regression equation that could be used to predict the number of days absent given the distance to work. What is the estimated regression model? c. What is the 99% confidence interval for the regression parameter 1? Based on this interval, what conclusion can you make about the hypotheses that the regression parameter 1 is equal to zero? d. What is the 99% confidence interval for the regression parameter 0? Based on this interval, what conclusion can you make about the hypotheses that the regression parameter 0 is equal to zero? e. How much of the variation in the sample values of number of days absent does the model you estimated in part (b) explain?arrow_forwardThe production department is proposing the purchase of an automatic insertion machine. It has identified three machines and has asked the accountant to analyze them to determine which one has the best average rate of return. Line Item Description Machine A Machine B Machine C Estimated average income $47,060.44 $72,961.50 $73,785.60 Average investment 336,146.00 243,205.00 491,904.00 a. Machine C b. Machine A c. Machines B and C have the same preferred average rate of return. d. Machine Barrow_forward
- Selecting a Basis for Predicting Shipping Expenses (Requires Computer Spreadsheet*) Cambridge SoundWorks sell portable speakers systems and bluetooth headphones. In an effort to improve the planning and control of shipping expenses, management is trying to determine which of three variables-units shipped, weight shipped, or sales value of units shipped- has the closest relationship with shipping expenses. The following information is available: Weight Sales Value of Shipping Month Units Shipped Shipped (lbs.) Units Shipped Expenses May 10,000 7,500 $350,000 $38,000 June 12,000 8,760 July 15,000 9,200 August 20,000 10,500 432,000 42,000 420,000 50,100 400,000 72,500 September 12,000 7,600 300,000 41,000 October 8,000 6,000 320,000 35,600 Required a. With the aid of a spreadsheet program, determine whether units shipped, weight shipped, or sales value of units shipped has the closest relationship with shipping expenses. Complete the r-squared values between each possible independent…arrow_forwardA data analyst decided to do all design work from home and wants to create a home office. The analyst needs a new computer for $1,900 and printer/scanner for $250. A vendor offers a financing option of a monthly installment of $99 for a period of 24 months. First payment is due at the end of the month of purchase. The vendor will accept either a cash payment upfront or financing over 24 months as mentioned earlier. Rationally, for the vendor, it does not make an economic difference if the customer chooses to pay now or financing (options are equivalent. Therefore, [a] What is the monthly interest rate implied in the vendor's offer? [b] If the engineer requested a 6-month installment instead of 24 months and the vendor agrees for the same interest rate as part [a] what would be the monthly payment be in this case?arrow_forwardYou have been commissioned to estimate the demand curve for admission to Lake Saint- Michel, a recreational fishing site in France. To do this, you spend a day surveying visitor to the site. You divide the area around the site into 3 zones. You ask each person you interview where they come from. Based on that information, and figures on annual attendance at the park, you are able to calculate the annual number of visitors from each zone. Your data are shown below. For each zone, the total travel cost 1 euro per person for each kilometer traveled to and from the site. One-Way Distance from Park Origin Total Number of Population Users (in kilometer) A 6.25 125,000 18,750 B 12.5 937,500 93,750 18.75 1,250,000 62,500 b. Suppose a fee were charged to enter the site. What is the per capita demand function for each origin? Please express the relationship in an equation. Calculate the number of visitors and consumer surplus if no fee were C. charged to enter the park.arrow_forward
- You have been commissioned to estimate the demand curve for admission to Lake Saint- Michel, a recreational fishing site in France. To do this, you spend a day surveying visitor to the site. You divide the area around the site into 3 zones. You ask each person you interview where they come from. Based on that information, and figures on annual attendance at the park, you are able to calculate the annual number of visitors from each zone. Your data are shown below. For each zone, the total travel cost 1 euro per person for each kilometer traveled to and from the site. One-Way Distance from Park Origin Total Number of Population Users (in kilometer) A 6.25 125,000 18,750 B 12.5 937,500 93,750 18.75 1,250,000 62,500 а. Express the relationship between per capita visitation rate (R) and travel cost (TC) in an equation. b. Suppose a fee were charged to enter the site. What is the per capita demand function for each origin? Please express the relationship in an equation. Calculate the number…arrow_forwardJohnson Filtration. Inc., provides maintenance service for water filtration systems throughout southern Florida. Customers contact Johnson with requests for maintenance service on their water filtration systems. To estimate the service time and the service cost. Johnson’s managers want to predict the repair time necessary for each maintenance request. Hence, repair time in hours is the dependent variable. Repair time is believed to be related to three factors: the number of months since the last maintenance service, the type of repair problem (mechanical or electrical), and the repairperson who performs the repair (Donna Newton or Bob Jones). Data for a sample of 10 service calls are reported in the following table: Develop the simple linear regression equation to predict repair time given the number of months since the last maintenance service, and use the results to test the hypothesis that no relationship exists between repair time and the number of months since the last maintenance service at the 0.05 level of significance. What is the interpretation of this relationship? What does the coefficient of determination tell you about this model? Using the simple linear regression model developed in part (a), calculate the predicted repair time and residual for each of the 10 repairs in the data. Sort the data in ascending order by value of the residual. Do you see any pattern in the residuals for the two types of repair? Do you see any pattern in the residuals for the two repairpersons? Do these results suggest any potential modifications to your simple linear regression model? Now create a scatter chart with months since last service on the x-axis and repair time in hours on the y-axis for which the points representing electrical and mechanical repairs are shown in different shapes and/or colors. Create a similar scatter chart of months since last service and repair time in hours for which the points representing repairs by Bob Jones and Donna Newton are shown in different shapes and/or colors. Do these charts and the results of your residual analysis suggest the same potential modifications to your simple linear regression model? Create a new dummy variable that is equal to zero if the type of repair is mechanical and one if the type of repair is electrical. Develop the multiple regression equation to predict repair time, given the number of months since the last maintenance service and the type of repair. What are the interpretations of the estimated regression parameters? What does the coefficient of determination tell you about this model? Create a new dummy variable that is equal to zero if the repairperson is Bob Jones and one if the repairperson is Donna Newton. Develop the multiple regression equation to predict repair time, given the number of months since the last maintenance service and the repairperson. What are the interpretations of the estimated regression parameters? What does the coefficient of determination tell you about this model? Develop the multiple regression equation to predict repair time, given the number of months since the last maintenance service, the type of repair, and the repairperson. What are the interpretations of the estimated regression parameters? What does the coefficient of determination tell you about this model? Which of these models would you use? Why?arrow_forwardJay Corporation has provided data from a two-year period to aid in planning. The Controller has asked you to prepare a contribution format income statement. Use the information included in the Excel Simulation and the Excel functions described below to complete the task. • Cell Reference: Allows you to refer to data from another cell in the worksheet. From the Excel Simulation below, if in a blank cell, "=84" was entered, the formula would output the result from cell B4. or 17.000 in this example. • Basle Math funetlons: Allows you to use the basic math symbols to perform mathematical functions. You can use the following keys: (plus sign to add). - (minus sign to subtract). * (asterisk sign to multiply), and / (forward slash to divide). From the Excel Simulation below, if in a blank cell "=B19+B20" was entered, the formula would add the values from those cells and output the result, or 183,.800 in this example. If using the other math symbols the result would output an appropriate…arrow_forward
arrow_back_ios
SEE MORE QUESTIONS
arrow_forward_ios
Recommended textbooks for you
 Managerial Accounting: The Cornerstone of Busines...AccountingISBN:9781337115773Author:Maryanne M. Mowen, Don R. Hansen, Dan L. HeitgerPublisher:Cengage Learning
 Essentials of Business Analytics (MindTap Course ...StatisticsISBN:9781305627734Author:Jeffrey D. Camm, James J. Cochran, Michael J. Fry, Jeffrey W. Ohlmann, David R. AndersonPublisher:Cengage Learning
 Excel Applications for Accounting PrinciplesAccountingISBN:9781111581565Author:Gaylord N. SmithPublisher:Cengage Learning
Managerial Accounting: The Cornerstone of Busines...
Accounting
ISBN:9781337115773
Author:Maryanne M. Mowen, Don R. Hansen, Dan L. Heitger
Publisher:Cengage Learning
Essentials of Business Analytics (MindTap Course ...
Statistics
ISBN:9781305627734
Author:Jeffrey D. Camm, James J. Cochran, Michael J. Fry, Jeffrey W. Ohlmann, David R. Anderson
Publisher:Cengage Learning
Excel Applications for Accounting Principles
Accounting
ISBN:9781111581565
Author:Gaylord N. Smith
Publisher:Cengage Learning
How to Estimate Project Costs: A Method for Cost Estimation; Author: Online PM Courses - Mike Clayton;https://www.youtube.com/watch?v=YQ2Wi3Jh3X0;License: Standard Youtube License