Concept explainers
Videos
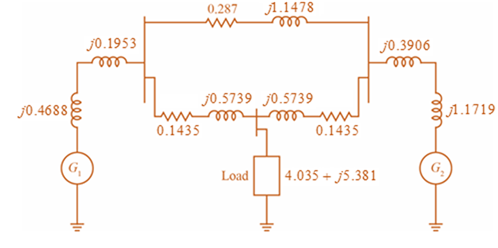
Consider the single-Line diagram of a power system shown in Figure 3.42 with equipment ratings given:
Generator G1: 50 MVA, 13.2 kV, x=0.15 p.u.
Generator G2: 20 MVA, 13.8 kV, x=0.15 p.u.
Three-phase Δ-Y transformer T1: 80 MVA, 13.2Δ/165YkV, X=0.1 p.u.
Three-phase Y-Δ transformer T2: 40 MVA, 165Y/13.8ΔkV, X=0.1 p.u.
Load: 40 MVA, 0.8PF lagging, operating at 150 kV
Choose a base of 100 MVA for the system and 132-kV base in the transmission-line circuit. Let the load be modeled as a parallel combination of resistance and inductance. Neglect transformer phase shifts. Draw a per-phase equivalent circuit of the system showing all impedances in per unit.

Trending nowThis is a popular solution!

Chapter 3 Solutions
Power System Analysis and Design (MindTap Course List)


- Draw the complete circular stator winding for a three phase delta connected AC generator consisting of 4 poles and 24 slots using a parallel connection. Your submission must consist of two drawings as follows: One drawing must show the winding arrangement of the phasegroups in the slots of the stator highlighting the start and finish of each phasegroup The other drawing must show only the end connections of each phase group for a parallel connection of the phasegroups and a delta connection of the phases The use of AutoCad or any other software is encouraged.arrow_forwardFor the oscillator resonance circuit shown in Fig. (5), derive the oscillation frequency, Feedback and open-loop gains. R1 C1 C2 ww R2 HH Fig.(5)arrow_forwardFor the oscillator resonance circuit shown in Fig. (5), derive the oscillation frequency, Feedback and open-loop gains. Vo L C I C ли ER Vsarrow_forward
- not use aiarrow_forwardFor the Fig. name, derive and determine all gains, frequency and draw the output waveform. Choose Q-15, and Q=6. Choose C₁-20 µF, C₂-5 µF, L=25mH. R₂ 12 HHarrow_forward1. (30pts) The input to a system is a DC component, a message, m(t), and a carrier, c(t). The output of the system is the square of the sum of the inputs. Determine if it is possible to retrieve DSB-SC modulated waveform. Show your work.arrow_forward
- 2) (20pts) m(t) and an unmodulated carrier, c(t), are given below m(t) = 2.2 cos(2л400t) – 7 cos(2л700t) +5 cos(2500) volts c(t) = 6 cos(2л2000) volts Sketch the amplitude spectrum for a Double Sideband Suppressed Carrier modulated waveform. You must carefully label all axes and provide each frequency component value (the x-value); each amplitude in Volts/Hz (the y-value). Include both negative and positive frequencies.arrow_forwardnot use ai pleasearrow_forwardFor the circuit shown, find the voltage vo using superposition. Let Vs1-11, V2=27 V, 1-4, R₁-8 02, R2=5 Q2, R3-17 02, R4-2002 and R5-14 02. In particular show your values for: V01, Vo due to Is only: V01- V02, Vo due to V51 only: Voz V03, Vo due to V52 only: V03= Then Vo Vo VSI +1 RI ww ww V. IS V. V. V. R3 R5 ww www + Vo R2 www R4 V$2 The relative tolerance for this problem is 10 %.arrow_forward
 Power System Analysis and Design (MindTap Course ...Electrical EngineeringISBN:9781305632134Author:J. Duncan Glover, Thomas Overbye, Mulukutla S. SarmaPublisher:Cengage Learning