
Videos
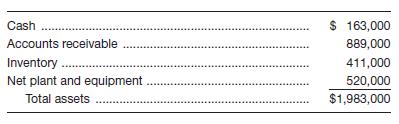
Jim Short’s Company makes clothing for schools. Sales in 20X1 were
b. In 20X2, sales increased to $5,740,000 and the assets for that year were as follows:
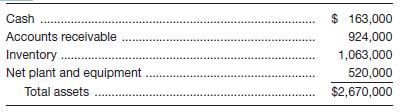
Once again, compute the four ratios.
c. Indicate if there is an improvement or decline in total asset turnover, and based on the other ratios, indicate why this development has taken place.
Want to see the full answer?
Check out a sample textbook solution
Chapter 3 Solutions
Loose Leaf for Foundations of Financial Management Format: Loose-leaf


- Revenue and expense data for Young Technologies Inc. are as follows: Year 2 Year 1 Sales $500,000 $440,000 Cost of goods sold 325,000 242,000 Selling expense 70,000 79,200 Administrative expenses 75,000 70,400 Income tax expense 10,500 16,400 Required: Question Content Area a. Prepare an income statement in comparative form, stating each item for both years as an amount and as a percent of sales. Round percentage amounts to nearest whole percent. Young Technologies Inc.Comparative Income StatementFor the Years Ended December 31, Year 2 and Year 1 Year 2 Amount Year 2 Percent Year 1 Amount Year 1 Percent $- Select - - Select -% $- Select - - Select -% - Select - - Select -% - Select - - Select -% $- Select - - Select -% $- Select - - Select -% - Select - - Select -% - Select - - Select -% - Select - - Select -% - Select - - Select -% Total expenses $fill in the blank 3bd7f90c1fc4f97_26 fill in…arrow_forwardRevenue and expense data for Young Technologies Inc. are as follows: Year 2 Year 1 Sales $500,000 $440,000 Cost of goods sold 325,000 242,000 Selling expenses 70,000 79,200 Administrative expenses 75,000 70,400 Income tax expense 10,500 16,400 Required: (a) Prepare an income statement in comparative form, stating each item for both years as an amount and as a percent of sales. Round your percentages answers to one decimal place. Enter all amounts as positive numbers. (b) Comment on the significant changes disclosed by the comparative income statement. Prepare an income statement in comparative form, stating each item for both years as an amount and as a percent of sales. Round your percentages answers to one decimal place. Enter all amounts as positive numbers. Young Technologies Inc. Comparative Income Statement For the Years Ended December 31, Year 2 and Year 1 1 Year 2 Year 2 Year 1 Year 1…arrow_forwardThe balance sheet for Revolution Clothiers is shown below. Sales for the year were $3,190,000, with 75 percent of sales sold on credit. REVOLUTION CLOTHIERS Balance Sheet 20X1 Assets Cash Accounts receivable Inventory Plant and equipment Total assets $ 24,000 283,000 266,000 450,000 a. Current ratio b. Quick ratio c. Debt-to-total-assets ratio d. Asset turnover e. Average collection period $ 1,023,000 Accounts payable Accrued taxes Liabilities and Equity times times % times days Bonds payable (long-term) Common stock Paid-in capital Retained earnings Total liabilities and equity Compute the following ratios: Note: Use a 360-day year. Do not round intermediate calculations. Round your answers to 2 decimal places. Input your debt-to- total assets answer as a percent rounded to 2 decimal places. $ 279,000 107,000 130,000 100,000 150,000 257,000 $ 1,023,000arrow_forward
- Select financial information for Beta Corp. for the fiscal years ending December 20X4 and 20X5 is as follows: please find the attached image 1 and 2 5. Beta Corp. has calculated the following asset management ratios: Asset management 20X5 20X4A/R turnover 3.3 5.1Inventory turnover 1.4 1.2 Based on the above ratios, which of the following statements is true? a) Beta was more efficient in collecting its credit sales from customers in 20X5 than in the prior year. It was also more efficient in turning inventory into sales than in the prior year.b) Beta was less efficient in collecting its credit sales from customers in 20X5 than in the prior year. It was also less efficient in turning inventory into sales than in the prior year.c) Beta was less efficient in collecting its credit sales from customers in 20X5 than in the prior year. However, it was more efficient in turning inventory into sales than in the prior year.d) Beta was more efficient in…arrow_forwarde. The average sale period. (The inventory at the beginning of last year totaled$1,920,000.) f. The operating cycle. g. The total asset turnover. (The total assets at the beginning of last year totaled$12,960,000.)arrow_forward5. Revenue and expense data for Young Technologies Inc. are as follows: Year 2 Year 1 Sales $500,000 $440,000 Cost of goods sold 325,000 242,000 Selling expenses 70,000 79,200 Administrative expenses 75,000 70,400 Income tax expense 10,500 16,400 Required: a. Prepare an income statement in comparative form, stating each item for both years as an amount and as a percent of sales. Round percentage amounts to nearest whole percent. ... b. Complete the following regarding the significant changes disclosed by the comparative income statement. The vertical analysis indicates that the cost of goods sold as a percent of sales (increased/decreased) between the two years. Selling and administrative expenses as a percentage of sales (increased/decreased) and income tax expense (increased/decreased). Overall, net income as a percent of sales (increased/decreased).arrow_forward
- The balance sheet for Revolution Clothiers is shown below. Sales for the year were $3,200,000, with 75 percent of sales sold on credit. Assets Cash Accounts receivable Inventory Plant and equipment Total assets REVOLUTION CLOTHIERS Balance Sheet 20X1 a. Current ratio b. Quick ratio c. Debt-to-total-assets ratio d. Asset turnover e. Average collection period $ 25,000 351,000 251,000 423,000 $ 1,050,000 Accounts payable Accrued taxes Liabilities and Equity times times % times days Bonds payable (long-term) Common stock Paid-in capital Retained earnings Total liabilities and equity $ 247,000 97,000 136,000 Compute the following ratios: Note: Use a 360-day year. Do not round intermediate calculations. Round your answers to 2 decimal places. Input your debt-to- total assets answer as a percent rounded to 2 decimal places. 100,000 150,000 320,000 $ 1,050,000arrow_forwardRevenue and expense data for Young Technologies Inc. are as follows: Year 2 Year 1 Sales $500,000 $440,000 Cost of merchandise sold 325,000 242,000 Selling expenses 70,000 79,200 Administrative expenses 75,000 70,400 Income tax expense 10,500 16,400 Required: Question Content Area a. Prepare an income statement in comparative form, stating each item for both years as an amount and as a percent of sales. Round percentage amounts to nearest whole percent. Young Technologies Inc.Comparative Income StatementFor the Years Ended December 31, Year 2 and Year 1 Year 2 Amount Year 2 Percent Year 1 Amount Year 1 Percent $- Select - - Select -% $- Select - - Select -% - Select - - Select - - Select - - Select - $- Select - - Select -% $- Select - - Select -% $- Select - - Select -% $- Select - - Select -% - Select - - Select - - Select - - Select - Total expenses $fill in the blank 86d00500602205c_26 fill in the…arrow_forward6A. During the current year, Sokowski Manufacturing earned income of $489,887 from total sales of $5,104,801 and average capital assets of $10,251,147. What is the sales margin? Round to the nearest hundredth, two decimal places and submit the answer in a percentage.arrow_forward
- McDonald’s Corporation (MCD) reported the following balance sheet and income statement data for two recent years: (amounts are in $ millions) Total assets Net Income SalesYear 1: $33,803.70 $5,192.30 $22,820.40Year 2: $32,811.20 $5,924.30 $21,025.20 What was McDonald’s asset turnover ratio for Year 2?arrow_forwardArshadi Corp.'s sales last year were $49,000, and its total assets were $22,000. What was its total assets turnover ratio (TATO)? Select the correct answer. a. 3.03 b. 0.63 c. 1.43 d. 3.83 e. 2.23arrow_forwardThe balance sheet for Revolution Clothiers is shown below. Sales for the year were $3,490,000, with 75 percent of sales sold on credit. Assets Cash Accounts receivable Inventory Plant and equipment Total assets REVOLUTION CLOTHIERS Balance Sheet 20X1 a. Current ratio b. Quick ratio c. Debt-to-total-assets ratio d. Asset turnover e. Average collection period $ 38,000 Accounts payable Accrued taxes 292,000 248,000 500,000 $ 1,078,000 Bonds payable (long-term) Common stock Paid-in capital Retained earnings Total liabilities and equity Liabilities and Equity times times % Compute the following ratios: Note: Use a 360-day year. Do not round intermediate calculations. Round your answers to 2 decimal places. Input your debt-to- total assets answer as a percent rounded to 2 decimal places. times days $ 262,000 148,000 178,000 100,000 150,000 240,000 $ 1,078,000arrow_forward
 Principles of Accounting Volume 2AccountingISBN:9781947172609Author:OpenStaxPublisher:OpenStax College
 Managerial Accounting: The Cornerstone of Busines...AccountingISBN:9781337115773Author:Maryanne M. Mowen, Don R. Hansen, Dan L. HeitgerPublisher:Cengage Learning