
Videos
a.
To calculate: The return on stockholders’ equity for Cable Corporation and Multi-Media Inc. and compute which firm has higher revenue.
Introduction:
Return on stockholders’ equity:
It is a profitability ratio that computes the capability of a company to generate profits out of the investments made by its shareholders.
a.
Answer to Problem 17P
The return on stockholders’ equity for Cable Corporation is 13.05% and that for Multi-Media Inc.is 33.1%.
Multi-Media Inc. has higher returns on stockholders’ equity than Cable Corporation.
Explanation of Solution
Calculation of the return on stockholders’ equity for Cable Corporation:
Calculation of the return on stockholders’ equity for Multi-Media Inc.:
b.
To determine: The additional ratios for both the firms.
Introduction:
The ratio of net income to sales:
It is used to compute the profit margin ratio, which shows the degree to the company makes money from its business activities.
The ratio of net income to total assets:
It is used to compute the
The ratio of sales to total assets:
It is used to compute the asset turnover ratio of the company, which shows the capability of the assets of a company to generate sales or revenue.
b.
Answer to Problem 17P
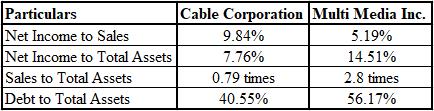
Calculation of additional ratios for Cable Corporation and Multi Media Incorporation:
Explanation of Solution
Explanatio n:
Calculation of the ratio of net income to sales for Cable Corporation:
Calculation of the ratio of net income to total assets for Cable Corporation:
Calculation of the ratio of sales to total assets for Cable Corporation:
Calculation of the ratio of debt to total assets for Cable Corporation:
Calculation of the ratio of net income to sales for Multi-Media Inc.:
Calculation of the ratio of net income to total assets for Multi-Media Inc.:
Calculation of the ratio of sales to total assets for Multi-Media Inc.:
Calculation of the ratio of debt to total assets for Multi-Media Inc.:
c.
To explain: Whether the addition or detraction of factors from part (b) in one firm gives higher return on stockholders’ equity than the value of other firm that is computed in part (a).
Introduction:
Du point analysis:
It is a structure used for examining fundamental performance by comparing the operational efficiencies of two firms. It helps in scrutinizing the strengths and weaknesses that need to be addressed.
c.
Answer to Problem 17P
The factor that leads to a higher return on total assets of Multi-Media Inc. is that the total asset turnover is more favorable for Multi-Media Inc. as compared to Cable Corporation. The total asset turnover for Multi-Media Inc. is 2.8 while that for Cable Corporation is 0.79.
The debt ratio of Multi-Media Inc. is also higher than that of Cable Corporation, which means that the total assets financed by stockholders’ equity is in a lesser percentage, which leads to higher returns on stockholders’ equity.
Explanation of Solution
The total asset turnover shows the capacity of a firm to generate revenue from its assets. The total asset turnover of Multi-Media Inc. is 2.8, which is more than the total asset turnover ratio of Cable Corporation of 0.79.
The debt ratio shows the leverage capacity of the company. Multi-Media Inc. has a higher debt ratio of 56.17% as compared to that of Cable Corporation, which is 40.55%.
Want to see more full solutions like this?
Chapter 3 Solutions
Loose Leaf for Foundations of Financial Management Format: Loose-leaf


- The average liabilities, average stockholders' equity, and average total assets are as follows: 1. Determine the following ratios for both companies, rounding ratios and percentagesto one decimal place: a. Return on total assets b. Return on stockholders' equity c. Times interest earned d. Ratio of total liabilities to stockholders' equity 2. Based on the information in (1), analyze and compare the two companies'solvency and profitability. Comprehensive profitability and solvency analysis Marriott International, Inc., and Hyatt Hotels Corporation are two major owners and managers of lodging and resort properties in the United States. Abstracted income statement information for the two companies is as follows for a recent year (in millions): Balance sheet information is as follows:arrow_forwardAnalyze and compare Bank of America and Wells Fargo Bank of America Corporation (BAC) and Wells Fargo Company (WFC) are two large financial services companies. The following data (in millions) were taken from a recent years financial statements for both companies: a. Compute the earnings per share for both companies. Round to the nearest cent. a. Which company appears to be more profitable on an earnings-per-share basis? b. Which company would you expect to have the larger quoted market price?arrow_forwardDefine each of the following terms: Liquidity ratios: current ratio; quick, or acid test, ratio Asset management ratios: inventory turnover ratio; days sales outstanding (DSO); fixed assets turnover ratio; total assets turnover ratio Financial leverage ratios: debt ratio; times-interest-earned (TIE) ratio; EBITDA coverage ratio Profitability ratios: profit margin on sales; basic earning power (BEP) ratio; return on total assets (ROA); return on common equity (ROE) Market value ratios: price/earnings (P/E) ratio; price/cash flow ratio; market/book (M/B) ratio; book value per share Trend analysis; comparative ratio analysis; benchmarking DuPont equation; window dressing; seasonal effects on ratiosarrow_forward
- Quiz 2: Solvency Debt-to-equity ratio Times interest earned ratio Debt service coverage ratio Cash flow from operations to capital expenditures ratio Profitability Return on assets ratio Return on sales ratio Asset turnover ratio Return on common stockholders equity ratio Leverage Earnings per share (EPS) Price/earnings (P/E) ratio Dividend payout ratio Dividend yield ratio A measure of a companys success in earning a return for the common stockholders. The relationship between a companys performance according to the income statement and its performance in the stock market. The ability of a company to remain in business over the long term. A variation of the profit margin ratio; measures earnings before payments to creditors. A companys bottom line stated on a per-share basis. The percentage of earnings paid out as dividends. The ratio of total liabilities to total stockholders equity. A measure of the ability of a company to finance long-term asset acquisitions with cash from operations. A measure of a companys success in earning a return for all providers of capital. The relationship between net sales and average total assets. The relationship between dividends and the market price of a companys stock. The use of borrowed funds and amounts contributed by preferred stockholders to earn an overall return higher than the cost of these funds. An income statement measure of the ability of a company to meet its interest payments. A statement of cash flows measure of the ability of a company to meet its interest and principal payments. How well management is using company resources to earn a return on the funds invested by various groups.arrow_forwardCompute the following profitability measures for Esplanade Enterprises for 20-2: (a) Profit margin ratio (b) Return on assets (ROA) (c) Return on common stockholders equity (ROE) (d) Earnings per share of common stock (EPS)arrow_forwardStockholder Profitability Ratios The following information pertains to Montague Corporation Required: Calculate the return on common equity and the earnings per share. (Note: Round answers to two decimal places.)arrow_forward
- A Comparing Financial Ratios Presented below are selected ratios the four firms, Badgley is a heavy equipment manu1icturer. Reagan is a newspaper publisher. Klein is a food manufacturer, and Taylor is a grocery chain. Required: 1. Which firm has the weakest current ratio? 2. CONCEPTUAL CONNECTION Explain why the turnover ratios vary so much among the four firms. 3. CONCEPTUAL CONNECTION Explain why the return on equity ratio is larger than the return on asset ratio for all four firms. 4. CONCEPTUAL CONNECTION Discuss whether the large differences in the return on equity ratios can exist over long periods of time.arrow_forwardRatio Analysis Consider the following information. Required: Calculate the stockholder payout ratios. (Note: Round answers to two decimal places.) Calculate the stockholder profitability ratios. (Note: Round answers to two decimal places.)arrow_forward

 Cornerstones of Financial AccountingAccountingISBN:9781337690881Author:Jay Rich, Jeff JonesPublisher:Cengage Learning
 Intermediate Financial Management (MindTap Course...FinanceISBN:9781337395083Author:Eugene F. Brigham, Phillip R. DavesPublisher:Cengage Learning
 Financial AccountingAccountingISBN:9781337272124Author:Carl Warren, James M. Reeve, Jonathan DuchacPublisher:Cengage LearningCentury 21 Accounting Multicolumn JournalAccountingISBN:9781337679503Author:GilbertsonPublisher:Cengage