
Loose Leaf for Foundations of Financial Management Format: Loose-leaf
17th Edition
ISBN: 9781260464924
Author: BLOCK
Publisher: Mcgraw Hill Publishers
expand_more
expand_more
format_list_bulleted
Videos
Textbook Question
Chapter 3, Problem 13P
Front Beam Lighting Company has the following ratios compared to its industry for last year:
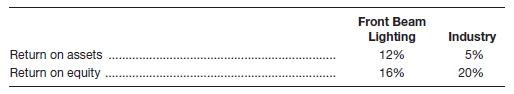
Explain why the return-on-equity ratio is so much less favorable than the return-on-assets ratio compared to the industry. No numbers are necessary; a one- sentence answer is all that is required.
Expert Solution & Answer
Want to see the full answer?
Check out a sample textbook solution
Students have asked these similar questions
The new owners of Pak. Electric Co. have hired you to help them diagnose and cure problems that the company has had in maintaining adequate liquidity. As a first step, you perform a liquidity analysis. You then do an analysis of the company’s short-term activity ratios. Your calculations and appropriate industry norms are listed.RatiosCurrent RatioPak. Electric Co. 4.5Industry Average 4.0Quick RatioPak. Electric Co. 2.0Industry Average 3.1Inventory TurnoverPak. Electric Co. 6.0Industry Average 10.4Average Collection PeriodPak. Electric Co. 73 daysIndustry Average 52 daysAverage Payment PeriodPak. Electric Co. 31 days40 daysa. What recommendations relative to the amount and the handling of inventory could you make to the new owners?b. What recommendations relative to the amount and the handling of accounts receivable could you make to the new owners?
The initial analysis should include the following:
The ratio equation
The calculation of the ratio using the equation with the financial data from the two assigned companies.
Use the result in a sentence; i.e. For every dollar invested in assets the company is earning 22.4 cents or 22.4% in net income.
Then explain whether this is a good result or a result that needs improving.
The original post should include at least three (3) sentences but no more than seven (7) sentences.
A company has been in business for a number of years. Merkel has the following financial ratios:
return on equity (ROE) = 85%Net profit margin= 19%total asset turnover= 4.9earnings quality= 0.5debt-to-equity ratio= 4.2
question:
Prepare an analysis of this company. Discuss and interpret the financial ratios above. what at the strengths AND weaknesses of the company? are there any troubling signs?
Chapter 3 Solutions
Loose Leaf for Foundations of Financial Management Format: Loose-leaf
Ch. 3 - If we divide users of ratios into short-term...Ch. 3 - Explain how the Du Pont system of analysis breaks...Ch. 3 - If the accounts receivable turnover ratio is...Ch. 3 - Prob. 4DQCh. 3 - Is there any validity in rule-of-thumb ratios for...Ch. 3 - Why is trend analysis helpful in analyzing ratios?...Ch. 3 - Inflation can have significant effects on income...Ch. 3 - What effect will disinflation following a highly...Ch. 3 - Why might disinflation prove favorable to...Ch. 3 - Comparisons of income can be very difficult for...
Ch. 3 - Low Carb Diet Supplement Inc. has two divisions....Ch. 3 - Database Systems is considering expansion into a...Ch. 3 - Prob. 3PCh. 3 - Prob. 4PCh. 3 - Prob. 5PCh. 3 - Dr. Zhivà€go Diagnostics Corp.’s income...Ch. 3 - The Haines Corp. shows the following financial...Ch. 3 - Easter Egg and Poultry Company has $2,000,000 in...Ch. 3 - Prob. 9PCh. 3 - Prob. 10PCh. 3 - Baker Oats had an asset turnover of 1.6 times per...Ch. 3 - AllState Trucking Co. has the following ratios...Ch. 3 - Front Beam Lighting Company has the following...Ch. 3 - Prob. 14PCh. 3 - Prob. 15PCh. 3 - Jerry Rice and Grain Stores has $4,780,000 in...Ch. 3 - Prob. 17PCh. 3 - Prob. 18PCh. 3 - Prob. 19PCh. 3 - Prob. 20PCh. 3 - Jim Short’s Company makes clothing for schools....Ch. 3 - The balance sheet for Stud Clothiers is shown...Ch. 3 - The Lancaster Corporation’s income statement is...Ch. 3 - Prob. 24PCh. 3 - Prob. 25PCh. 3 - Prob. 26PCh. 3 - Prob. 27PCh. 3 - Prob. 28PCh. 3 - The Global Products Corporation has three...Ch. 3 - Prob. 30PCh. 3 - Prob. 31PCh. 3 - Prob. 32PCh. 3 - Prob. 33PCh. 3 - Prob. 34PCh. 3 - The following information is from Harrelson...Ch. 3 - Using the financial statements for the Snider...Ch. 3 - Given the financial statements for Jones...Ch. 3 - Prob. 2WE
Knowledge Booster


Learn more about
Need a deep-dive on the concept behind this application? Look no further. Learn more about this topic, finance and related others by exploring similar questions and additional content below.Similar questions
- AllState Trucking Co. has the following ratios compared to its industry for 2007. AllState Trucking Industry Return on sales (i.e. Profit margin) 3% 8% Return on assets 15% 10% Please use Du Pont system of analysis to calculate and explain why the return-on-assets ratio is so much more favorable than the return-on-sales ratio compared to the industry.arrow_forwardFront Beam Lighting Company has the following ratios compared to its industry for 2008. Front Beam Lighting Industry Return on assets 12% 5% Return on equity 16% 20% Please use Du Pont system of analysis to calculate and explain why the return-on-equity ratio is so much less favorable than the return-on-assets ratio compared to the industry.arrow_forwardWhich of the following is most likely true concerning the stability and trend of earnings? 1. require at leaset 5 years of historical data to be meaningful 2. are not factored in the analysis of revenues 3. depend on the trend of a dingle industry 4. are key factors when calculating cost of salesarrow_forward
- Please select the option that best analyzes the PROFIT MARGIN for our example company. The profit margin indicates the amount of sales that are ultimately realized as income after all expenses are considered. Profit margin is not a good measure of how well a company performs, so this information does not indicate how well our company is performing financially. The profit margin indicates the amount of sales that are ultimately realized as income after all expenses are considered. Our company retains between 15-20% of its sales as income, which is a comfortable profit margin. The profit margin indicates the amount of sales that are ultimately realized as income after all expenses are considered. Our company retains between 80-85% of its income as sales, which is a very high profit margin. The profit margin indicates the amount of sales that are ultimately realized as income after all expenses are considered. Our company retains between 80-85% of its income as sales, which…arrow_forwardPROBLEM 11-17 Return on Investment (ROI) and Residual Income LO11-1, LO11-2 Financial data for Joel de Paris, Inc., for last year follow: Joel de Paris, Inc. Balance Sheet Beginning Ending Balance Balance Assets Cash $ 140,000 $ 120,000 Accounts receivable 450,000 530,000 Inventory 320,000 380,000 Plant and equipment, net 680,000 620,000 Investment in Buisson, S.A. 280,000 170,000 250,000 Land (undeveloped) 180,000 Total assets $2,020,000 $2,100,000 Liabilities and Stockholders' Equity Accounts payable. $ 360,000 $ 310,000 Long-term debt Stockholders' equity 1,500,000 1,500,000 160,000 290,000 Total liabilities and stockholders' equity $2,020,000 $2,100,000 Joel de Paris, Inc. Income Statement Sales $4,050,000 Operating expenses Net operating income 3,645,000 405,000 Interest and taxes: Interest expense $150,000 Таx expense 110,000 260,000 Net income $ 145,000 The company paid dividends of $15,000 last year. The "Investment in Buisson, S.A.," on the balance sheet represents an…arrow_forwardYour Task… Using your assigned financial statements calculate the required ratios below Indicate if the change from year to year is favorable or unfavorable. All values should be accurate to at least two decimal places. The expectation is to submit a professional report free of grammar and spelling errors and easy to read. Think of this as a menu you would be handing to a customer. All calculations are to be represented. Analysis of Profitability Gross Profit Ratio Operating Profit Ratio Net Profit Ratio Sales to Total Assets Ratio Return on Total Assets Return on Equity Earnings Per Sharearrow_forward
- Bogart Company is considering two alternatives. Alternative A will have revenues of $149,900 and costs of $103,900. Alternative B will have revenues of $184,300 and costs of $123,800. Compare Alternative A to Alternative B showing incremental revenues, costs, and net income. (Enter negative amounts using either a negative sign preceding the number e.g. -45 or parentheses e.g. (45).) Alternative Alternative Net Income Increase (Decrease) Revenues 24 2$ Costs Net Income$ is better thanarrow_forwardWildhorse Company is considering two alternatives. Alternative A will have revenues of $149,900 and costs of $103,900. Alternative B will have revenues of $184,300 and costs of $123,800. Compare Alternative A to Alternative B showing incremental revenues, costs, and net income. (Enter negative amounts using either a negative sign preceding the number e.g. -45 or parentheses e.g. (45).) Revenues Costs Net Income Alternative B Alternative A $ tA $ Alternative A is better than $ LA LA $ Alternative B LA LA $ Net Income Increase (Decrease)arrow_forwardAn analyst is evaluating the profi tability of Daimler AG (Xetra: DAI) over a recentfi ve-year period. He gathers the following revenue data and calculates the followingprofi tability ratios from information in Daimler’s annual reports:2009 2008 2007 2006 2005Revenues (€ millions) 78,924 98,469 101,569 99,222 95,209Gross profi t margin 16.92% 21.89% 23.62% 20.60% 19.48%Operating profi t (EBIT) margin a–1.92% 2.77% 8.58% 5.03% 3.02%Pretax margin –2.91% 2.84% 9.04% 4.94% 2.55%Net profi t margin –3.35% 1.73% 4.78% 3.19% 2.37%aEBIT (Earnings before interest and taxes) is the operating profi t metric used by Daimler.Daimler’s revenue declined from 2007 to 2008 and from 2008 to 2009. Further,Daimler’s 2009 revenues were the lowest of the fi ve years. Management’s discussion ofthe decline in revenue and EBIT in the 2009 Annual Report notes the following:Th e main reason for the decline [in EBIT] was a signifi cant drop in revenuedue to markedly lower unit sales in all vehicle segments as a…arrow_forward
- Calculate Zumwalt’s net profit margin and debt ratio. Earth’s Best Company has sales of $200,000, a net income of $15,000, and the following balance sheet: . The company’s new owner thinks that inventories are excessive and can be lowered to the point where the current ratio is equal to the industry average, 2.5, without affecting either sales or net income. If inventories are sold off and not replaced so as to reduce the current ratio to 2.5, if the funds generated are used to reduce common equity (stock can be repurchased at book value), and if no other changes occur, by how much will the ROE change? b. Now suppose we wanted to take this problem and modify it for use on an exam—that is, to create a new problem that you have not seen to test yourknowledge of this type of problem. How would your answer change if we made the following changes: (1) We doubled all of the dollar amounts? (2) We stated that the target current ratio was 3.0? (3) We said that the company had 10,000 shares of…arrow_forwardBalance Sheet Beginning Balance Ending Balance Assets $ 131,000 334,000 579,000 786,000 401,000 255,000 $ 2,486,000 $ 126,000 480,000 483,000 781,000 435,000 251,000 $ 2,556,000 Cash Accounts receivable Inventory Plant and equipment, net Investment in Buisson, S.A. Land (undeveloped) Total assets Liabilities and Stockholders' Equity Accounts payable Long-term debt Stockholders' equity $381,000 1,020,000 1,085,000 $ 2,486,000 $ 347,000 1,020,000 1,189,000 $ 2,556,000 Total liabilities and stockholders' equity Joel de Paris, Incorporated Income Statement $ 4,255,000 3,489,100 765,900 Sales Operating expenses Net operating income Interest and taxes: $ 116,000 199,000 Interest expense Тах еxpense 315,000 $ 450,900 Net income The company paid dividends of $346,900 last year. The "Investment in Buisson, S.A.," on the balance sheet represents an investment in the stock of another company. The company's minimum required rate of return of 15%.arrow_forwardCrane Company is considering two alternatives. Alternative A will have revenues of $149,100 and costs of $101,400. Alternative B will have revenues of $170,000 and costs of $125,400. Compare Alternative A to Alternative B showing incremental revenues, costs, and net income. (Enter negative amounts using either a negative sign preceding the number e.g. -45 or parentheses e.g. (45).) Revenues Costs Net Income $ Alternative A is better than Alternative B Net Income Increase (Decrease)arrow_forward
arrow_back_ios
SEE MORE QUESTIONS
arrow_forward_ios
Recommended textbooks for you

Financial ratio analysis; Author: The Finance Storyteller;https://www.youtube.com/watch?v=MTq7HuvoGck;License: Standard Youtube License