
Concept explainers
Videos
a
To draw
a
Explanation of Solution
Given information:
Let

The above table shows the percent of U.S households with Internet access from 2007 through 2012.
Graph:
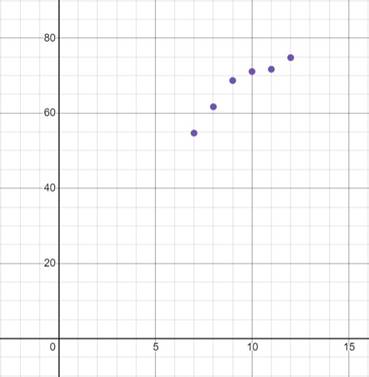
Interpretation:
Using the graphing utility, the scatter plot for the given data is shown above.
b
To find a quadratic model for the data using regression feature of a graphing utility.
b
Explanation of Solution
Given information:

Calculation:
Using the graphing utility to find the regression,
Insert the data in the table in a grpahic utility to get the following results:
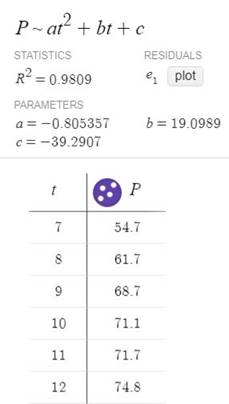
Conclusion:
Therefore, from the above figure, the regression equation for the quadratic model is
c
To draw the graph with the scatter plot from subpart (a) using a graphing utility.
c
Explanation of Solution
Given information:
Graph:
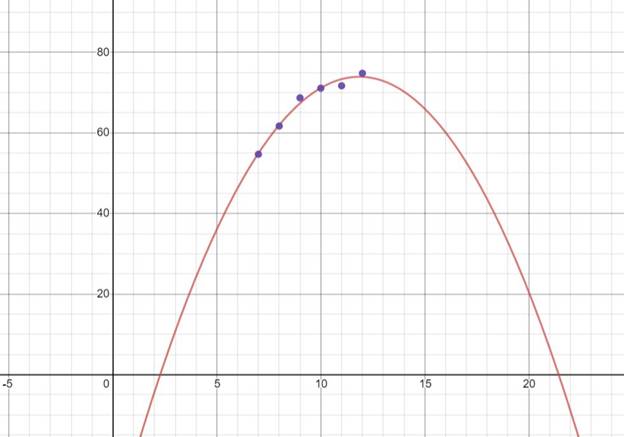
Interpretation:
Using a graphing utility, a parabola is formed when the data is kept on a graph.
d
To use the model and find the year in which the U.S households with Internet access less than 60%.
d
Answer to Problem 19E
No, it is not a good model.
Explanation of Solution
Given information:
Refer to the graph in subpart (c).
With the help of the equation
On Substituting
It is observed that the values are higher than the given table occurs for different values of
Therefore, this is a not good model for making future predictions.
Chapter 2 Solutions
Precalculus with Limits: A Graphing Approach


 Calculus: Early TranscendentalsCalculusISBN:9781285741550Author:James StewartPublisher:Cengage Learning
 Thomas' Calculus (14th Edition)CalculusISBN:9780134438986Author:Joel R. Hass, Christopher E. Heil, Maurice D. WeirPublisher:PEARSON
 Calculus: Early Transcendentals (3rd Edition)CalculusISBN:9780134763644Author:William L. Briggs, Lyle Cochran, Bernard Gillett, Eric SchulzPublisher:PEARSON
 Calculus: Early TranscendentalsCalculusISBN:9781319050740Author:Jon Rogawski, Colin Adams, Robert FranzosaPublisher:W. H. Freeman
 Calculus: Early Transcendental FunctionsCalculusISBN:9781337552516Author:Ron Larson, Bruce H. EdwardsPublisher:Cengage Learning