
Concept explainers
Videos
(a)
Comparison of two distributions ranges.
(a)
Answer to Problem 92E
Ranges of the two distributions are approximately the same.
Explanation of Solution
Given information:
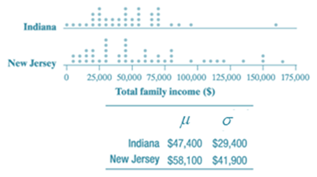
In the Indiana distribution, the data values
In the New Jersey distribution, the data values range from approximately $5000 to approximately $165,000. It has been shown in the dotplot that the leftmost dot corresponds to approx. $5,000 and the rightmost dot corresponds to approx. $165,000.
Now,
The difference between largest data value and smallest data value gives the range.
For Indiana:
For New Jersey:
Note that
For both the distributions, the range is approx. $160,000.
Thus,
The two distributions have approx. equal ranges.
(b)
The standard deviation of the total family incomes in the New Jersey sample is so much larger than for the Indiana sample.
(b)
Answer to Problem 92E
When compared to the Indiana distribution, the New Jersey distribution contains a lot more unusually large data values.
Explanation of Solution
Given information:

Note that
The Indiana distribution consists of only one outliner (approx. at $160,000), since there is only one point which is separated by a large gap from the other dots.
Although, the New Jersey distribution seems to have more outliners, since between $0 and $80,000, a lot more dots appear to be in the tail to the right of the bulk of dots.
Then
The standard deviation
Chapter 2 Solutions
PRACTICE OF STATISTICS F/AP EXAM
Additional Math Textbook Solutions
Introductory Statistics (2nd Edition)
Statistics for Psychology
Introductory Statistics


 MATLAB: An Introduction with ApplicationsStatisticsISBN:9781119256830Author:Amos GilatPublisher:John Wiley & Sons Inc
 Probability and Statistics for Engineering and th...StatisticsISBN:9781305251809Author:Jay L. DevorePublisher:Cengage Learning
 Statistics for The Behavioral Sciences (MindTap C...StatisticsISBN:9781305504912Author:Frederick J Gravetter, Larry B. WallnauPublisher:Cengage Learning
 Elementary Statistics: Picturing the World (7th E...StatisticsISBN:9780134683416Author:Ron Larson, Betsy FarberPublisher:PEARSON
 The Basic Practice of StatisticsStatisticsISBN:9781319042578Author:David S. Moore, William I. Notz, Michael A. FlignerPublisher:W. H. Freeman
 Introduction to the Practice of StatisticsStatisticsISBN:9781319013387Author:David S. Moore, George P. McCabe, Bruce A. CraigPublisher:W. H. Freeman