
Concept explainers
Videos
(a)
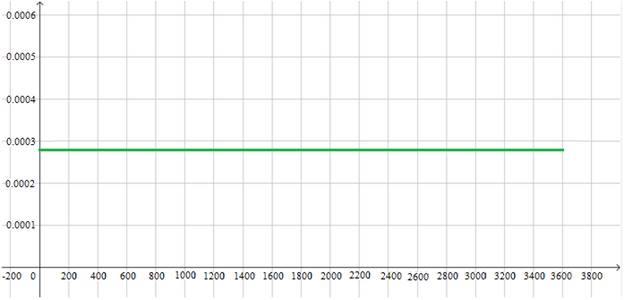
Density curve to model the amount of time after an hour at which a request is received by the web server including scales on both axes.
(a)
Answer to Problem 42E
When
Explanation of Solution
Given information:
The distribution has been modeled according to uniform distribution on the interval
Such that
And
Calculations:
With uniform distribution, the density curve is reciprocal to the difference of the boundaries.
On the interval between the boundaries,
With
(b)
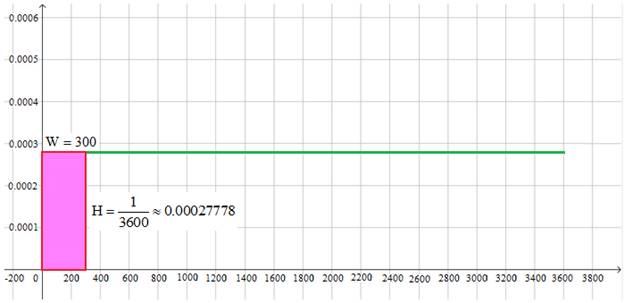
Proportion of requests received within the first 300 seconds after the hour.
(b)
Answer to Problem 42E
About 0.0833 of the requests are received within first 300 seconds after the hour.
Explanation of Solution
Given information:
Time for receiving requests,
Calculations:
The area underneath the density curve for all the values preceding 300 will be the probability that the time of receiving requests is less than 300 seconds.
Note that
Area underneath the density curve will be the rectangle.
With
Width,
And
Height,
Then
Therefore,
About 0.0833 of the requests are received within first 300 seconds (5 minutes) after the hour.
(c)
(c)
Answer to Problem 42E
Interquartile
Explanation of Solution
Given information:
The distribution has been modeled according to uniform distribution on the interval
Such that
And
Calculations:
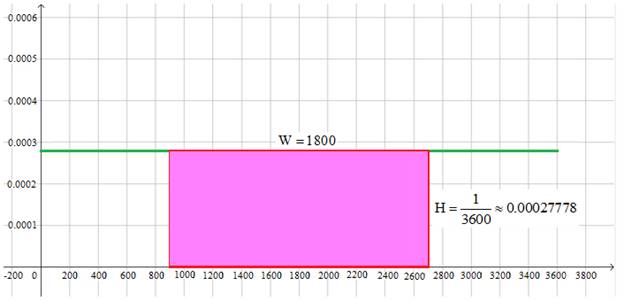
Interquartile range is the difference between the 1st and 3rd quartile.
The property of 1st quartile reveals that 25% of the data values are below it.
The property of 3rd quartile reveals that 75% of the data values are below it.
Although, the distribution is uniform between
Then
Although, the distribution is uniform between
Then
The difference between the 1st and 3rd quartile gives the interquartile range.
Thus,
The units of both interquartile range and data values will be the same.
Therefore,
The interquartile range is 1800 seconds.
Chapter 2 Solutions
PRACTICE OF STATISTICS F/AP EXAM
Additional Math Textbook Solutions
Basic Business Statistics, Student Value Edition (13th Edition)
Introductory Statistics
Essentials of Statistics, Books a la Carte Edition (5th Edition)
Elementary Statistics Using Excel (6th Edition)


 MATLAB: An Introduction with ApplicationsStatisticsISBN:9781119256830Author:Amos GilatPublisher:John Wiley & Sons Inc
 Probability and Statistics for Engineering and th...StatisticsISBN:9781305251809Author:Jay L. DevorePublisher:Cengage Learning
 Statistics for The Behavioral Sciences (MindTap C...StatisticsISBN:9781305504912Author:Frederick J Gravetter, Larry B. WallnauPublisher:Cengage Learning
 Elementary Statistics: Picturing the World (7th E...StatisticsISBN:9780134683416Author:Ron Larson, Betsy FarberPublisher:PEARSON
 The Basic Practice of StatisticsStatisticsISBN:9781319042578Author:David S. Moore, William I. Notz, Michael A. FlignerPublisher:W. H. Freeman
 Introduction to the Practice of StatisticsStatisticsISBN:9781319013387Author:David S. Moore, George P. McCabe, Bruce A. CraigPublisher:W. H. Freeman