
Concept explainers
Videos
(a)
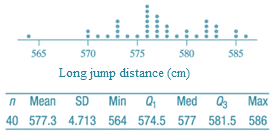
Shape of the distribution of corrected long jump distance.
(a)
Answer to Problem 21E
The distribution is roughly symmetric with a single peak.
Explanation of Solution
Given information:
The corrected long − jump distances when decreased by 20 cm, they become uncorrected long − jump distances.
When each data value of the distribution gets decreased by 20 cm, the shape of the distribution will not be affected.
Thus,
Both corrected and uncorrected long − jump distances will have same shape of distribution.
Note that
Since most of the data values roughly lie in the middle of the dotplot, the distribution is roughly symmetric.
Also note that
There is a single peak in the dotplot, which is at 576.
Thus,
The shape of the distribution of corrected long − jump distances will be roughly symmetric with a single peak.
(b)
(b)
Answer to Problem 21E
New mean,
New median,
Explanation of Solution
Given information:

The corrected long − jump distances when decreased by 20 cm, they become uncorrected long − jump distances.
Since mean and median represent the center of data set, both of them will also decrease by 20 cm.
New Mean,
New Median,
Thus,
The corrected long − jump distances will new mean of 557.3 cm and new median of 557 cm.
(c)
Standard deviation and
(c)
Answer to Problem 21E
New standard deviation,
Interquartile
Explanation of Solution
Given information:

Difference between 3rd and 1st quartile gives interquartile range.
Interquartile range,
When every data value gets decreased by 20, the data values variability will not be affected. Thus, variation measures such as IQR and standard deviation remain unchanged.
New standard deviation,
Thus,
The corrected long − jump distances will have an interquartile range of 7.0 cm and standard deviation of 4.713 cm.
Chapter 2 Solutions
PRACTICE OF STATISTICS F/AP EXAM
Additional Math Textbook Solutions
Statistics for Business and Economics (13th Edition)
Introductory Statistics (10th Edition)
Introductory Statistics
Elementary Statistics (13th Edition)
Fundamentals of Statistics (5th Edition)


 MATLAB: An Introduction with ApplicationsStatisticsISBN:9781119256830Author:Amos GilatPublisher:John Wiley & Sons Inc
 Probability and Statistics for Engineering and th...StatisticsISBN:9781305251809Author:Jay L. DevorePublisher:Cengage Learning
 Statistics for The Behavioral Sciences (MindTap C...StatisticsISBN:9781305504912Author:Frederick J Gravetter, Larry B. WallnauPublisher:Cengage Learning
 Elementary Statistics: Picturing the World (7th E...StatisticsISBN:9780134683416Author:Ron Larson, Betsy FarberPublisher:PEARSON
 The Basic Practice of StatisticsStatisticsISBN:9781319042578Author:David S. Moore, William I. Notz, Michael A. FlignerPublisher:W. H. Freeman
 Introduction to the Practice of StatisticsStatisticsISBN:9781319013387Author:David S. Moore, George P. McCabe, Bruce A. CraigPublisher:W. H. Freeman