
Concept explainers
Videos
(a)
To find: The equation and
(a)
Answer to Problem 32E
The
Explanation of Solution
Given information:
The least squares regression line for a set of data. The equations and r-values for the models are given.
Formula used:
The TI83 calculator is used.
Calculation:
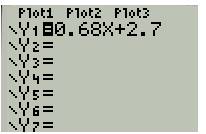
Consider the following equation
Use TI83 calculator to draw the graph of the equation
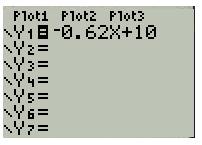
Step1: Press Y: button and enter the above equation
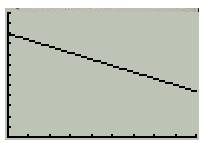
The display is as shown below
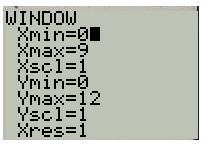
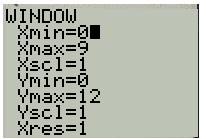
Step2: Press WINDOW button and set the range of the axis
The display is as shown below
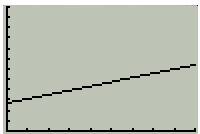
Step3: Press Graph button to graph the above sequence
The display is as shown below
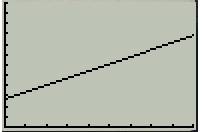
Note that the above graph is same as the graph provide in option (iii).
Therefore, the equation
Also, since the slope of the equation
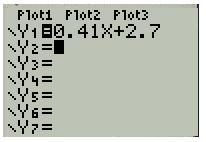
Consider the following equation
Use TI83 calculator to draw the graph of the equation
Step1: Press Y: button and enter the above equation
The display is as shown below
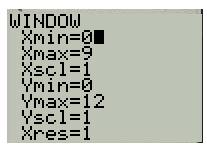
Step2: Press WINDOW button and set the range of the axis
The display is as shown below
Step3: Press Graph button to graph the above sequence
The display is as shown below
Note that the above graph is same as the graph provide in option (ii).
Therefore, the equation y = 0.41x + 2.7 represents the graph (ii)
Also, since the slope of the equation
Consider the following equation
Use T|83 calculator to draw the graph of the equation
Step1: Press Y: button and enter the above equation
The display is as shown below
Step2: Press WINDOW button and set the range of the axis
The display is as shown below
Step3: Press Graph button to graph the above sequence
The display is as shown below
Note that the above graph is same as the graph provide in option (i).
Therefore, the equation
Also, since the slope of the equation
Conclusion:
The correlation coefficient that represents the graph.
(b)
To analyse: The model that best fits the data.
(b)
Answer to Problem 32E
The model number 3 fits the data well which represents
Explanation of Solution
Given information:
According to the correlation coefficients, to determine the best fit for the data.
Formula used:
Correlation coefficients are used.
Calculation:
According to the correlation coefficients, model number 3 fits the data well which represents
Conclusion:
The model number 3 fits the data well which represents
Chapter 1 Solutions
PRECALCULUS W/LIMITS:GRAPH.APPROACH(HS)


 Calculus: Early TranscendentalsCalculusISBN:9781285741550Author:James StewartPublisher:Cengage Learning
 Thomas' Calculus (14th Edition)CalculusISBN:9780134438986Author:Joel R. Hass, Christopher E. Heil, Maurice D. WeirPublisher:PEARSON
 Calculus: Early Transcendentals (3rd Edition)CalculusISBN:9780134763644Author:William L. Briggs, Lyle Cochran, Bernard Gillett, Eric SchulzPublisher:PEARSON
 Calculus: Early TranscendentalsCalculusISBN:9781319050740Author:Jon Rogawski, Colin Adams, Robert FranzosaPublisher:W. H. Freeman
 Calculus: Early Transcendental FunctionsCalculusISBN:9781337552516Author:Ron Larson, Bruce H. EdwardsPublisher:Cengage Learning