Concept explainers
(a)
To sketch: the graph of the given function.
(a)
Explanation of Solution
Given information:
The function
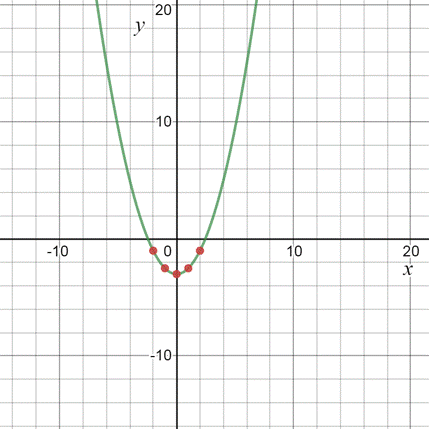
Graph:
The given function is sketched as shown below.

Interpretation
From the graph, it can be seen that the given function is initially decreasing in nature over a range of values and then increases with increase in x .
(b)
To find: the nature of the function from the graph and using a table of values of the function.
(b)
Answer to Problem 33E
The given function decreases in the range
Explanation of Solution
Given information:
The function
From the graph of the function in previous part, it can be seen that, for all values of x from -8 to 0, the value of f (x ) decreases. Then, in the range 0 to 8, it increases. Thus,
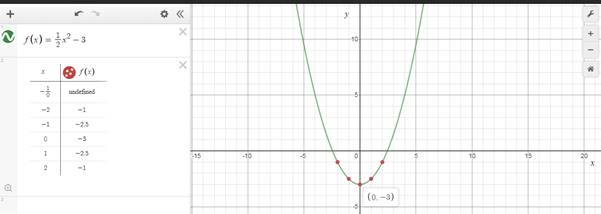
Now, the values of the given function for different values of x are shown in the below table.

From the table, it can be verified that, for all the values of x considered, the function initially shows a decreasing nature and the root point being (0,3) from where, the function shows a steady increase. The function is symmetric with respect to the y-axis and takes a parabolic path.
Chapter 1 Solutions
PRECALCULUS W/LIMITS:GRAPH.APPROACH(HS)
- 1/ Solve the following: 1 x + X + cos(3X) -75 -1 2 2 (5+1) e 5² + 5 + 1 3 L -1 1 5² (5²+1) 1 5(5-5)arrow_forwardI need expert handwritten solution.to this integralarrow_forwardHow to understand and learn Laurent's serial and what's the point of Laurent's serial And what are the steps of a smooth solution for Laurentarrow_forward
- Example: If ƒ (x + 2π) = ƒ (x), find the Fourier expansion f(x) = eax in the interval [−π,π]arrow_forwardPlease can you give detailed steps on how the solutions change from complex form to real form. Thanks.arrow_forwardExamples: Solve the following differential equation using Laplace transform (e) ty"-ty+y=0 with y(0) = 0, and y'(0) = 1arrow_forward
 Calculus: Early TranscendentalsCalculusISBN:9781285741550Author:James StewartPublisher:Cengage Learning
 Thomas' Calculus (14th Edition)CalculusISBN:9780134438986Author:Joel R. Hass, Christopher E. Heil, Maurice D. WeirPublisher:PEARSON
 Calculus: Early Transcendentals (3rd Edition)CalculusISBN:9780134763644Author:William L. Briggs, Lyle Cochran, Bernard Gillett, Eric SchulzPublisher:PEARSON
 Calculus: Early TranscendentalsCalculusISBN:9781319050740Author:Jon Rogawski, Colin Adams, Robert FranzosaPublisher:W. H. Freeman
 Calculus: Early Transcendental FunctionsCalculusISBN:9781337552516Author:Ron Larson, Bruce H. EdwardsPublisher:Cengage Learning


