
Managerial Accounting (5th Edition)
5th Edition
ISBN: 9780134128528
Author: Karen W. Braun, Wendy M. Tietz
Publisher: PEARSON
expand_more
expand_more
format_list_bulleted
Videos
Textbook Question
Chapter 14, Problem 14.6SE
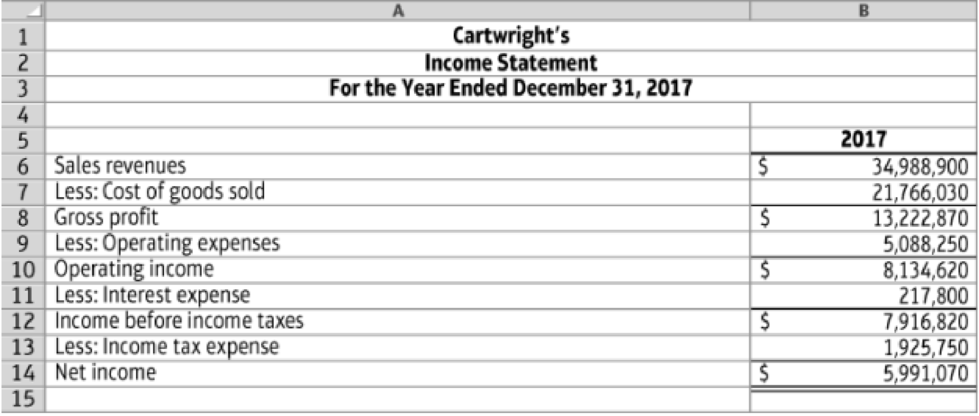
Cartwright’s Data Set used for S14-6 through S14-10:
Cartwright’s, a home-improvement store chain, reported these summarized figures:
14.1-73 Full Alternative Text
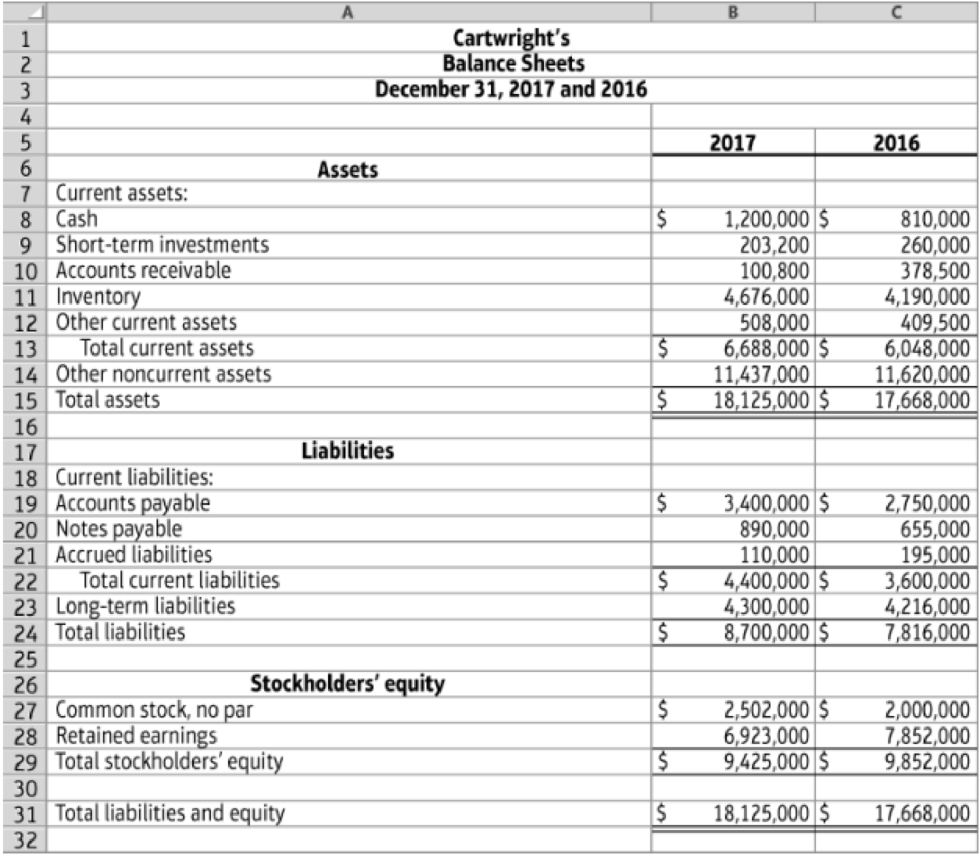
S14-6 Find
Refer to the Cartwright’s Data Set.
- a. Compute Cartwright’s current ratio at December 31, 2017 and 2016.
- b. Did Cartwright’s current ratio improve, deteriorate, or hold steady during 2017?
Expert Solution & Answer
Want to see the full answer?
Check out a sample textbook solution
Students have asked these similar questions
(Learning Objective 7: Calculate return on assets) Oscar Optical Corporation providesa full line of designer eyewear to consumers. Oscar reported the following information for 2018and 2017:2018 2017Sales revenue ...............................Net income..................................Average total assets.....................$500,000$ 43,700$230,000$410,000$ 34,650$210,000Compute return on assets (ROA) for 2018 and 2017. Using the DuPont model, identify thecomponents and state whether each improved or worsened from 2017 to 2018.
(Learning Objective 7: Calculate return on assets) Hometown Supply Companyreported the following information in its comparative financial statements for the fiscal yearended January 31, 2018:January 31,2018January 31,2017Net sales....................................Net earnings..............................Average total assets...................$84,000$ 4,200$70,000$82,600$ 4,050$69,450Requirements1. Compute the net profit margin ratio for the years ended January 31, 2018, and 2017. Did itimprove or worsen in 2018?2. Compute asset turnover for the years ended January 31, 2018, and 2017. Did it improve orworsen in 2018?3. Compute return on assets for the years ended January 31, 2018, and 2017. Did it improveor worsen in 2018? Which component—net profit margin ratio or asset turnover—wasmostly responsible for the change in the company’s return on assets?
OBJECTIVE: To enable learners to utilize financial ratios as a mechanism to evaluate the firm's financial
performance and identify areas for making decisions for improvement
REQUIREMENT: Financial Statement Analysis
Question
Refer to the following financial statements of Delima Corporation for 2019 and 2020:
Delima Corporation
Income Statements
For the year ended 31 December (in millions)
2020
$13,198
7,750
2019
$12,397
7,108
Net sales
Cost of goods sold
Gross profit
Selling and administrative expenses
Income from operations
5,448
5,289
3,472
3,299
1,976
1,990
Interest expense
233
248
Other (income) expense, net
11
1,732
503
1,229
Income before income taxes
1,742
Income tax expense
502
Net income
1,240
Delima Corporation
Balance Sheets
31 December (in millions)
2020
2019
Assets
Current assets
Cash
$460
$444
Accounts receivables (net)
1,188
1,132
1,190
1,056
225
2,915
3,128
Inventories
Other current assets
247
Total current assets
3,027
3,281
Property (net)
5,593
$11,901
Other assets…
Chapter 14 Solutions
Managerial Accounting (5th Edition)
Ch. 14 - (Learning Objective 1) Which of the following...Ch. 14 - Prob. 2QCCh. 14 - Prob. 3QCCh. 14 - Prob. 4QCCh. 14 - (Learning Objective 3) Which of the following is...Ch. 14 - (Learning Objective 4) Working capital is defined...Ch. 14 - Prob. 7QCCh. 14 - Prob. 8QCCh. 14 - Prob. 9QCCh. 14 - Prob. 10QC
Ch. 14 - Prob. 14.1SECh. 14 - Find trend percentages (Learning Objective 1)...Ch. 14 - Prob. 14.3SECh. 14 - Prepare common-size income statements (Learning...Ch. 14 - Analyze common-size income statements (Learning...Ch. 14 - Cartwrights Data Set used for S14-6 through...Ch. 14 - Cartwrights Data Set used for S14-6 through...Ch. 14 - Cartwrights Data Set used for S14-6 through...Ch. 14 - Prob. 14.9SECh. 14 - Prob. 14.10SECh. 14 - Prob. 14.11SECh. 14 - Prob. 14.12AECh. 14 - Prob. 14.13AECh. 14 - Prob. 14.14AECh. 14 - Prob. 14.15AECh. 14 - Prob. 14.16AECh. 14 - Calculate ratios (Learning Objective 4) Kelleher...Ch. 14 - Prob. 14.18AECh. 14 - Prob. 14.19AECh. 14 - Prob. 14.20AECh. 14 - Prob. 14.21AECh. 14 - Classify company sustainability measurements into...Ch. 14 - Prob. 14.23BECh. 14 - Prob. 14.24BECh. 14 - Prob. 14.25BECh. 14 - Prob. 14.26BECh. 14 - Prob. 14.27BECh. 14 - Calculate ratios (Learning Objective 4) Ponderosa...Ch. 14 - Prob. 14.29BECh. 14 - Prob. 14.30BECh. 14 - Prob. 14.31BECh. 14 - Calculate ratios (Learning Objective 4) Thornton...Ch. 14 - Prob. 14.33BECh. 14 - Prob. 14.34APCh. 14 - Comprehensive analysis (Learning Objectives 2, 3, ...Ch. 14 - Prob. 14.36APCh. 14 - Ratio analysis over two years (Learning Objective...Ch. 14 - Prob. 14.38APCh. 14 - Prob. 14.39BPCh. 14 - Prob. 14.40BPCh. 14 - Prob. 14.41BPCh. 14 - Ratio analysis over two years (Learning Objective...Ch. 14 - Make an investment decision (Learning Objective 4)...Ch. 14 - Prob. 14.44SCCh. 14 - Discussion Questions 1. Describe horizontal...Ch. 14 - Prob. 14.47ACTCh. 14 - Using financial statement ratios to analyze...
Knowledge Booster


Learn more about
Need a deep-dive on the concept behind this application? Look no further. Learn more about this topic, accounting and related others by exploring similar questions and additional content below.Similar questions
- Income and Education. Using Exhibit 1.8, discuss the relationship between annual income and the highest level of education completed. Provide specific examples of the difference between having no high school diploma and having a bachelors degree, and between having a bachelors degree and a professional degree.arrow_forwardPreparing operating activities using the direct method Amy’s Learning Center has assembled the following data for the year ended June 30, 2018: Prepare the operating activities section of the business’s statement year ended June 30,2018, using the direct method.arrow_forwardRequired: Compute the DuPont ratlos (profit margin, asset turnover, and financial leverage ratlos) for Amazon and Kroger given these numbers for 2012-2017. Check your numbers to make sure that Profit margin x Asset turnover Financial leverage = Return on equity. (Negative amounts should be entered with a minus sign. Round your answers to 4 decimal places.) Data: Problem 6-2 Data.xlsx. (Students can download this data file solve this problem.) AMZN KR Year 2017 2016 2015 2014 2013 2012 Year 2017 2016 2015 2014 2013 2012 2017 2016 2015 2014 2013 2012 2017 2016 2015 2014 2013 2012 Year Year Sales Revenue $177,866,000,000 $135,987,000,000 $107,006,000,000 $ 596,000,000 $ 88,988,000,000 $ (241,000,000) $54,505,000,000 $ 74,452,000,000 $ 274,000,000 $ 40,159,000,000 $ 61,093,000,000 $ (39,000,000) $32,555,000,000 Sales Revenue $122,662,000,000 $115,337,000,000 $109,830,000,000 $108,465,000,000 $ 98,375,000,000 $ 96,619,000,000 Net Income Assets $131,310,000,000 $ 3,033,000,000 $…arrow_forward
- 1. Compute the given in your module dated December 2018 using vertical analysis 2. Interpret the data comparing it to the data in December 2017, which year the company perform better 3. Create a pie graph for December 2018, using the data from vertical analysis.arrow_forwardInstructions: I. Resolve the ratios listed on table a for each year (2020 & 2021): a. For each ratio includes the formula with math computes (2020 & 2021) b. . Fill M&G Industries Ratio Analysis Table A. (2020 & 2021) II. Perform the following Analysis: a. Explain each ratio results for 2021 only. b. Compare each ratio performance with the previous year results (compare 2021 results with 2020 results) c. Compare each Ratio results for 2021 with their respective Industry average. III. Base on the previous results, evaluate and explain the Company financial position using the following questions: 1. How liquid is the firm? 2. Is management generating adequate operating profits on the firm’s assets? 3. How is the firm financing its assets? 4. Are the owners (stockholders) receiving an adequate return on their investment?arrow_forwardInstructions: I. Resolve the ratios listed on table a for each year (2020 & 2021): a. For each ratio includes the formula with math computes (2020 & 2021) b. . Fill M&G Industries Ratio Analysis Table A. (2020 & 2021) II. Perform the following Analysis: a. Explain each ratio results for 2021 only. b. Compare each ratio performance with the previous year results (compare 2021 results with 2020 results) c. Compare each Ratio results for 2021 with their respective Industry average.arrow_forward
- (Learning Objective 7: Evaluate liquidity using the quick [acid-test] ratio and days’sales in receivables) Northern Products reported the following amounts in its 2019 financialstatements. The 2018 amounts are given for comparison.2019 2018Current assets:Cash............................................ $ 9,500Short-term investments................ 7,000Accounts receivable..................... $70,100Less: Allowance foruncollectibles.......................$86,500(7,500) (5,500) 64,600Inventory..................................... 190,000Prepaid insurance ........................ 2,200Total current assets..................... 273,300Total current liabilities.................... 106,000Net sales (all on account) ................$ 9,50010,50079,000189,0002,200290,20099,0001,077,000 734,000Requirements1. Compute Northern’s quick (acid-test) ratio at the end of 2019. Round to two decimalplaces. How does the quick ratio compare with the industry average of 0.92?2. Compare days’ sales…arrow_forward(Learning Objective 7: Calculate return on assets) Handley Grocery Corporationreported the following information in its comparative financial statements for the fiscal yearended January 31, 2018:January 31,2018January 31,2017Net sales....................................Net earnings..............................Average total assets...................$50,000$ 2,200$40,000$48,350$ 2,100$39,300Requirements1. Compute the net profit margin ratio for the years ended January 31, 2018, and 2017. Did itimprove or worsen in 2018?2. Compute asset turnover for the years ended January 31, 2018, and 2017. Did it improve orworsen in 2018?3. Compute return on assets for the years ended January 31, 2018, and 2017. Did it improveor worsen in 2018? Which component—net profit margin ratio or asset turnover—wasmostly responsible for the change in the company’s return on assets?arrow_forwardDigital Learning * CengageNOwv2 | Online teachir * Cengage Learning + Assignment/takeAssignmentMain.do?invoker=&takeAssignmentSessionLocator=&inprogress=false A eBook Show Me How Percent of Sales Method At the end of the current year, Accounts Receivable has a balance of $555,000; Allowance for Doubtful Accounts has a credit balance of $5,000; and sales for the year total $2,500,000. Bad debt expense is estimated at 1/4 of 1% of sales. a. Determine the amount of the adjusting entry for uncollectible accounts. b. Determine the adjusted balances of Accounts Receivable, Allowance for Doubtful Accounts, and Bad Debt Expense. Accounts Receivable 24 Allowance for Doubtful Accounts Bad Debt Expense %24 c. Determine the net realizable value of accounts receivable. Feedback Check My Work a. Remember that since accounts receivable are created by credit sales, uncollectible accounts çan be estimated as a percent of credit sales. If the portion of credit sales to sales id relatively constant, the…arrow_forward
- The following information is taken from the records of Rosebloom Flowers for the year 2019. A. Calculate net income or net loss for January. B. Calculate net income or net loss for February. C. Calculate net income or net loss for March. D. For each situation, comment on how a stakeholder might view the firms performance. (Hint: think about the source of the income or loss.)arrow_forwardCase Study Questions What was the total postpaid revenue in 2017? What was the total net profit in 2017? Identify examples of strategies adopted by MAXIS in that year. How were the above strategies related to their Customer Relationship Management (CRM) and future sale?arrow_forwardC University of Technology and App X O BAFI2109/BAFI2110: CalculationX A moodle.nct.edu.om/mod/assign/view.php?id=47174 NCT e-Learning Portal Courses Reports e-Services - Academic Departments ETC - CIMS Soher Humai REN MOVing Forward Calculation of Profitability ratios - submission From the following data, calculate (a) Gross profit ratio (b) Net profit ratio Sales RO 300,000 Sales returns RO 10,000 Opening stock RO 70,000 Closing stock RO 25,000 Direct expenses RO 40,000 Purchases RO 140,000 Net profit RO 40,000 Share Capital RO 100,000 Reserve and Surplus RO 25,000 Long term Loans RO 50,000 Submission statusarrow_forward
arrow_back_ios
SEE MORE QUESTIONS
arrow_forward_ios
Recommended textbooks for you
 Pfin (with Mindtap, 1 Term Printed Access Card) (...FinanceISBN:9780357033609Author:Randall Billingsley, Lawrence J. Gitman, Michael D. JoehnkPublisher:Cengage Learning
 Principles of Accounting Volume 1AccountingISBN:9781947172685Author:OpenStaxPublisher:OpenStax College
Pfin (with Mindtap, 1 Term Printed Access Card) (...
Finance
ISBN:9780357033609
Author:Randall Billingsley, Lawrence J. Gitman, Michael D. Joehnk
Publisher:Cengage Learning
Principles of Accounting Volume 1
Accounting
ISBN:9781947172685
Author:OpenStax
Publisher:OpenStax College
Financial Projections for Startups Basic Walkthrough; Author: Mike Lingle;https://www.youtube.com/watch?v=7avegQF4dxI;License: Standard youtube license