
Managerial Accounting (5th Edition)
5th Edition
ISBN: 9780134128528
Author: Karen W. Braun, Wendy M. Tietz
Publisher: PEARSON
expand_more
expand_more
format_list_bulleted
Videos
Textbook Question
Chapter 14, Problem 14.42BP
Ratio analysis over two years (Learning Objective 4)
Comparative financial statement data of Hollingsworth, Inc., follow:
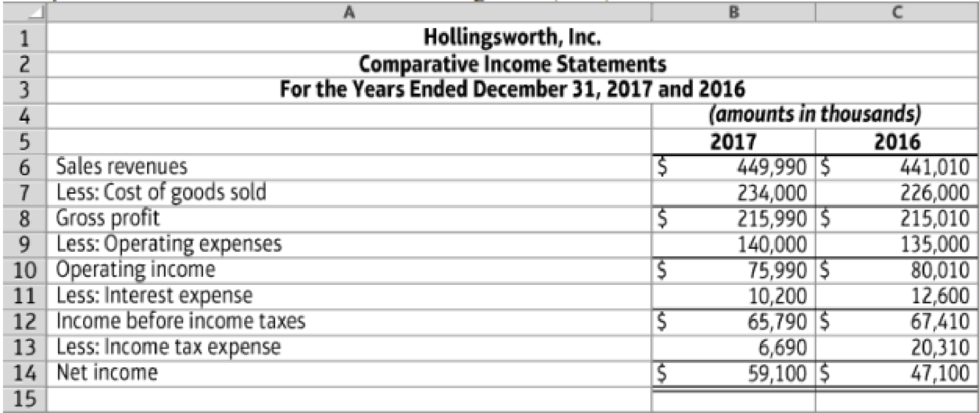
14.5-95 Full Alternative Text
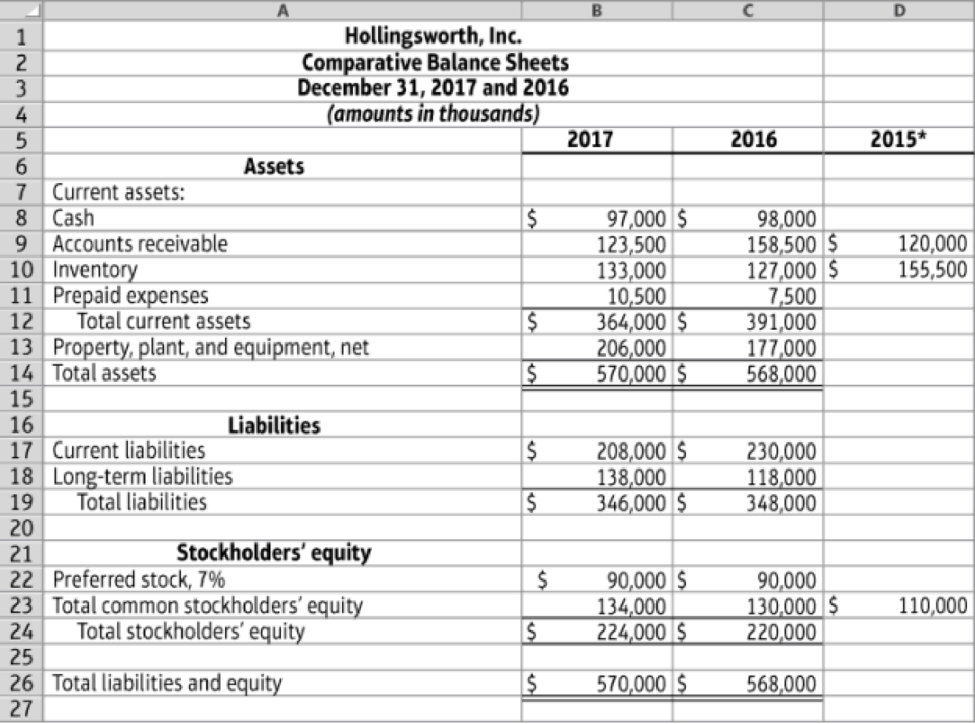
*Selected 2015 amounts
14.5-96 Full Alternative Text
- 1. Market price of Hollingsworths common stock: $50.60 at December 31, 2017, and $33.49 at December 31, 2016
- 2. Common shares outstanding: 12,000,000 during 2017 and 12,000,000 during 2016
- 3. All sales are credit sales
Requirements
- 1. Compute the following ratios for 2017 and 2016:
- a.
Current ratio - b. Times-interest-earned ratio
- c. Inventory turnover
- d. Operating income percentage
- e. Return on common stockholders’ equity
- f. Earnings per share of common stock
- g. Price/earnings ratio
- a.
- 2. Decide (a) whether Hollingsworth’s ability to pay debts and to sell inventory improved or deteriorated during 2017 and (b) whether the investment attractiveness of its common stock appears to have increased or decreased.
Expert Solution & Answer
Want to see the full answer?
Check out a sample textbook solution
Students have asked these similar questions
Using ratios to evaluate a stock investment
Comparative financial statement data of Garfield Inc. follow:
Market price of Garfield’s common stock:$69.36 at December 31 2018 and $38.04 at December 31, 2017.
Common shares outstanding 14, 000 on December 31, 2018 and 12,000 on December 31 2017 and 2016.
All sales are on credit.
Requirements
Compute the following ratios tor 2018 and 2017:
a. current ratio
b. Cash ratio
c. Times-interest-earned ratio
d. Inventory turnover
e. Gross profit percentage
f. Debt to equity ratio
g. Rate of return on common stockholder’s equity
h. Earnings per share of common stock
i. Price/earnings ratio
2. Decide (a) whether Garfield’s ability to pat debts and to sell inventory improved or deteriorated during 2018 and (b) whether the investment attractiveness of its common stock appears to have increased or decreased.
Additional information:
• Weighted-average ordinary shares in 2017 were $60,000
QUESTIONS
Based on the financial data above, do the following:
a. Calculate the financial ratio of VENUS TRADING COMPANY in 2017 below:
• Current ratio
• Account receivable turnover
• Inventory turnover
• Asset turnover
• Return on assets
• Return on ordinary shareholders equity
• Earnings per share
• Debts to total assets ratio
Provide an interpretation for each of the financial ratio calculations above.
b. Based on the calculation results in point a, provide an analysis of performance
finance VENUS TRADING COMPANY in 2017.
Calculating the WACC 2016 balance sheet.
Current assets. 2,000
Net fixed assets. -3,000
Total assets. -5,000
Accounts payable and accrual. 900
Short term debt. 100
Long term debt. 1,100
Preferred stock (10,000 shares). 250
Common stock (50,000 shares) 1,300
Retained earning 1,350
Total common equity. 2,650
Total liabilities and equity. 5,000
Sky earning per share last year were 3.20. The common stock sells for 55.00, last year dividend do was 2.10 and flotation cost of 10% would be required to sell new common stock. Security analysts are projecting that the common dividend will grow at an annual rate of 9% sky preferred stock pays a dividend of 3.30 per share and its preferred stock sells for 30.00 per share. The firm before tax cost of debt is 10% and its marginal tax rate is 35% the firm current outstanding 10% annual coupon rate is 6% and sky beta is 1.516. The firm total bent which is the sum of the company short-term debt and…
Chapter 14 Solutions
Managerial Accounting (5th Edition)
Ch. 14 - (Learning Objective 1) Which of the following...Ch. 14 - Prob. 2QCCh. 14 - Prob. 3QCCh. 14 - Prob. 4QCCh. 14 - (Learning Objective 3) Which of the following is...Ch. 14 - (Learning Objective 4) Working capital is defined...Ch. 14 - Prob. 7QCCh. 14 - Prob. 8QCCh. 14 - Prob. 9QCCh. 14 - Prob. 10QC
Ch. 14 - Prob. 14.1SECh. 14 - Find trend percentages (Learning Objective 1)...Ch. 14 - Prob. 14.3SECh. 14 - Prepare common-size income statements (Learning...Ch. 14 - Analyze common-size income statements (Learning...Ch. 14 - Cartwrights Data Set used for S14-6 through...Ch. 14 - Cartwrights Data Set used for S14-6 through...Ch. 14 - Cartwrights Data Set used for S14-6 through...Ch. 14 - Prob. 14.9SECh. 14 - Prob. 14.10SECh. 14 - Prob. 14.11SECh. 14 - Prob. 14.12AECh. 14 - Prob. 14.13AECh. 14 - Prob. 14.14AECh. 14 - Prob. 14.15AECh. 14 - Prob. 14.16AECh. 14 - Calculate ratios (Learning Objective 4) Kelleher...Ch. 14 - Prob. 14.18AECh. 14 - Prob. 14.19AECh. 14 - Prob. 14.20AECh. 14 - Prob. 14.21AECh. 14 - Classify company sustainability measurements into...Ch. 14 - Prob. 14.23BECh. 14 - Prob. 14.24BECh. 14 - Prob. 14.25BECh. 14 - Prob. 14.26BECh. 14 - Prob. 14.27BECh. 14 - Calculate ratios (Learning Objective 4) Ponderosa...Ch. 14 - Prob. 14.29BECh. 14 - Prob. 14.30BECh. 14 - Prob. 14.31BECh. 14 - Calculate ratios (Learning Objective 4) Thornton...Ch. 14 - Prob. 14.33BECh. 14 - Prob. 14.34APCh. 14 - Comprehensive analysis (Learning Objectives 2, 3, ...Ch. 14 - Prob. 14.36APCh. 14 - Ratio analysis over two years (Learning Objective...Ch. 14 - Prob. 14.38APCh. 14 - Prob. 14.39BPCh. 14 - Prob. 14.40BPCh. 14 - Prob. 14.41BPCh. 14 - Ratio analysis over two years (Learning Objective...Ch. 14 - Make an investment decision (Learning Objective 4)...Ch. 14 - Prob. 14.44SCCh. 14 - Discussion Questions 1. Describe horizontal...Ch. 14 - Prob. 14.47ACTCh. 14 - Using financial statement ratios to analyze...
Knowledge Booster


Learn more about
Need a deep-dive on the concept behind this application? Look no further. Learn more about this topic, accounting and related others by exploring similar questions and additional content below.Similar questions
- Comparative financial statement data of Garfield, Inc. follow: Market price of Garfield’s common stock: $69.36 at December 31, 2018, and $38.04 at December 31, 2017. Common shares outstanding: 14,000 on December 31, 2018 and 12,000 on December 31, 2017 and 2016. All sales are on credit. Compute the following ratios for 2018 and 2017: 2018 2017 a. Current ratio b. Cash ratio c. Times-interest-earned ratio d. Inventory turnover e. Gross profit percentage f. Debt to equity ratio g. Rate of return on common stockholders’ equity h. Earnings per share of common stock i. Price/earnings ratio Decide (a) whether Garfield’s ability to pay debts and to sell inventory improved or deteriorated during 2018 and (b) whether the investment attractiveness of its common stock appears to have increased or decreased.arrow_forwardProfitability Ratios The following selected data were taken from the financial statements of Vidahill Inc. for December 31, 2017, 20Y6, and 20Y5: December 31 20Y7 20Y6 20Y5 Total assets $163,000 $147,000 $131,000 Notes payable (8% interest) 50,000 50,000 50,000 Common stock 20,000 20,000 20,000 Preferred 5% stock, $100 par 10,000 10,000 10,000 (no change during year) Retained earnings 59,090 39,790 30,000 The 2017 net income was $19,800, and the 2016 net income was $10,290. No dividends on common stock were declared between 2015 and 20Y7. Preferred dividends were declared and paid in full in 2016 and 2017. a. Determine the return on total assets, the rate earned on stockholders' equity, and the return on common stockholders' equity for the years 2016 and 2017. When required, round to one decimal place. 20Y7 20Y6 Return on total assets Return on stockholders' equity Return on common stockholders' equity % % % % % % b. The profitability ratios indicate that Vidahill Inc.'s profitability…arrow_forwardProfitability ratios The following selected data were taken from the financial statements of Vidahill Inc. for December 31, 2017, 20Y6, and 20Y5: December 31 20Y7 December 31 20Y6 December 31 20Y5 Total assets $307,000 $277,000 $247,000 Notes payable (8% interest) 100,000 100,000 100,000 Common stock 40,000 40,000 40,000 Preferred 6% stock, $100 par (no change during year) Retained earnings 20,000 109,920 20,000 80,240 20,000 60,000 The 20Y7 net income was $30,880, and the 2016 net income was $21,440. No dividends on common stock were declared between 2015 and 2017. Preferred dividends were declared and paid in full in 2016 and 2017. a. Determine the return on total assets, the return on stockholders' equity, and the return on common stockholders' equity for the years 2016 and 2017. When required, round your answers to one decimal place. 20Y7 20Y6 Return on total assets Return on stockholders' equity Return on common stockholders' equity % % % % % % b. The profitability ratios indicate…arrow_forward
- S15-7 Computing rate of return on total assets Godhi's 2014 financial statements reported the following items-with 2013 figures given for comparison: Learning GODHI, INC. Balance Sheet As of December 31, 2014 and 2013 2014 2013 $ 33,538 $ 29,562 Total Assets 17,100 14,962 Total Liabilities Total Stockholders' Equity (all common) 16,438 14,600 $ 33,538 $ 29,562 Total Liabilities and Stockholders' Equity Net income for 2014 was $3,890 and interest expense was $210. Compute Godhi's rate of return on total assets for 2014. (Round to the nearest percent.)arrow_forwardFor years ended December 31 Equity Investee Financial Summary, $ millions 2018 2017 2016 Net sales... Gross margin Net income.. Cummins' share of net income. $7,352 $7,050 $5,654 1,373 1,422 1,182 647 680 499 $ 336 $ 308 $ 260 Royalty and interest income.. 58 49 41 Total equity, royalty and interest from investees... $ 394 $ 357 $ 301 Current assets $3,401 1,449 $3,416 1,379 Noncurrent assets Current liabilities.. Noncurrent liabilities.. Net assets... (2,669) (218) (2,567) (237) $1,963 $1,991 Cummins' share of net assets $1,144 $1,116 a. What assets and liabilities of unconsolidated affiliates are omitted from Cummins' balance sheet as a result of the equity method of accounting for those investments? b. Do the liabilities of the unconsolidated affiliates affect Cummins directly? Explain. c. How does the equity method impact Cummins' ROE and its RNOA components (net operating asset turnover and net operating profit margin)?arrow_forwardCompute DuPont Analysis Ratios Selected balance sheet and income statement information for Humana Inc., a health and well‑being company, follows. 2018 2017 2018 2018 Net 2018 2017 Stockholders’ Stockholders’ Company ($ millions) Ticker Revenue income Assets Assets Equity Equity Humana Inc HUM $66,610 $11,381 $35,111 $36,876 $19,859 $19,540 Compute the following 2018 ratios for Humana. a. Return on equity (ROE) Note: 1. Select the appropriate numerator and denominator used to compute ROE from the drop-down menu options. 2. Enter the numerator and denominator amounts to compute ROE. Numerator Denominator ROE Answer Answer Answer Answer b. Profit margin (PM) Note: 1. Select the appropriate numerator and denominator used to compute PM from the drop-down menu options. 2. Enter the numerator and denominator amounts to compute PM. Numerator Denominator PM Answer Answer Answer Answer c. Financial leverage…arrow_forward
- Selected financial information for Carla VistaCorporation as of December are presented below. Current assets Current liabilities Stockholders' equity Total assets 1. 2. 3. 4. 5. 6. Return on assets Net sales and net income for 2014 were $531,000 and $42,480 respectively. Dividends of $4,720 were declared for common stockholders and $7,080for preferred shareholders in 2014. Preferred stockholders' equity is equal to 10% of total stockholders' equity. Compute the indicated ratios at December 31, 2014, or for the year ended December 31, 2014, as appropriate. (Round answers to 2 decimal places, e.g. 2.12.) Profit margin Payout ratio Debt assets ratio 2014 Current ratio $118,640 49.560 141,600 354,000 2013 $90,860 41,300 125.080 318.600 Return on common stockholders' equity % % % :1 %arrow_forwardFinancial Statement data for the years ended December 31st for the Top Corporation follow:2018 2017Net Income $775,000 $966,000Preferred Dividends $35,000 $35,000Average number of 80,000 shares 95,000 sharescommon shares outstandinga. Determine the earnings per share for 2018 and 2017. b. Does the change in the earnings per share from 2017 to 2018 include a favorable or unfavorable trend?arrow_forwardI need the answer for number 3 year 2021 and 2019 Comparative Earnings per Share Lucas Company reports net income of $2,580 for the year ended December 31, 2019, its first year of operations. On January 4, 2019, Lucas issued 9,000 shares of common stock. On August 2, 2019, it issued an additional 4,200 shares of stock, resulting in 13,200 shares outstanding at year-end. During 2020, Lucas earned net income of $18,840. It issued 3,000 additional shares of stock on March 3, 2020, and declared and issued a 2-for-1 stock split on November 3, 2020, resulting in 32,400 shares outstanding at year-end. During 2021, Lucas earned net income of $31,104. The only common stock transaction during 2021 was a 20% stock dividend issued on July 2, 2021. If required, round your final answers to two decimal places. Required: 1. Compute the basic earnings per share that would be disclosed in the 2019 annual report.$ fill in the blank 1 per share2. Compute the 2019 and 2020 comparative basic earnings per…arrow_forward
- Computing earnings per share, price/earnings ratio, and rate of return on common stockholders’ equity Gullo Company reported these figures for 2018 and 2017: Requirements Compute Gullo Company’s earnings per share for 2018. Assume the company paid the minimum preferred dividend during 2018. Round to the nearest cent. Compute Gullo Company’s price/earnings ratio for 2018. Assume the company’s market price per share of common stock is $9. Round to two decimals. Compute Gullo Company’s rate of return on common stockholders’ equity for 2018. Assume the company paid the minimum preferred dividend during 2018. Round to the nearest whole percent.arrow_forwardCompute DuPont Analysis Ratios Selected balance sheet and income statement information for Humana Inc., a health and well-being company, follows. 2018 2017 Company ($ millions) Ticker Revenue income Assets Assets Humana Inc HUM $66,832 $11,603 $35,333 $37,098 2018 Compute the following 2018 ratios for Humana. a. Return on equity (ROE) $ $ Note: 1. Select the appropriate numerator and denominator used to compute ROE from the drop-down menu options. 2. Enter the numerator and denominator amounts to compute ROE. Numerator Denominator 0 $ $ 2018 Net 2018 2017 Stockholders' Stockholders' 0 $ ♦ 0 b. Profit margin (PM) Note: 1. Select the appropriate numerator and denominator used to compute PM from the drop-down menu options. 2. Enter the numerator and denominator amounts to compute PM. Numerator Denominator 0 $ ◆ Equity $20,081 0 ROE 0 PM c. Financial leverage (FL) Note: 1. Select the appropriate numerator and denominator used to compute FL from the drop-down menu options. 2. Enter the…arrow_forwardBasic earning per share ratio= (net income- prefered dividends)/weighted average common shares outstanding (21,331-0)/500= $42.66 (2020 year) (11,588-0)/494= $23.46 (2019 year) $5.19 (Walmart 2020 year) (competitor) Write financial analysis report.arrow_forward
arrow_back_ios
SEE MORE QUESTIONS
arrow_forward_ios
Recommended textbooks for you
 Cornerstones of Financial AccountingAccountingISBN:9781337690881Author:Jay Rich, Jeff JonesPublisher:Cengage Learning
 Financial Accounting: The Impact on Decision Make...AccountingISBN:9781305654174Author:Gary A. Porter, Curtis L. NortonPublisher:Cengage Learning
 Intermediate Accounting: Reporting And AnalysisAccountingISBN:9781337788281Author:James M. Wahlen, Jefferson P. Jones, Donald PagachPublisher:Cengage Learning
 Century 21 Accounting Multicolumn JournalAccountingISBN:9781337679503Author:GilbertsonPublisher:Cengage
Cornerstones of Financial Accounting
Accounting
ISBN:9781337690881
Author:Jay Rich, Jeff Jones
Publisher:Cengage Learning
Financial Accounting: The Impact on Decision Make...
Accounting
ISBN:9781305654174
Author:Gary A. Porter, Curtis L. Norton
Publisher:Cengage Learning
Intermediate Accounting: Reporting And Analysis
Accounting
ISBN:9781337788281
Author:James M. Wahlen, Jefferson P. Jones, Donald Pagach
Publisher:Cengage Learning
Century 21 Accounting Multicolumn Journal
Accounting
ISBN:9781337679503
Author:Gilbertson
Publisher:Cengage
Financial ratio analysis; Author: The Finance Storyteller;https://www.youtube.com/watch?v=MTq7HuvoGck;License: Standard Youtube License