
Horngren's Cost Accounting: A Managerial Emphasis (16th Edition)
16th Edition
ISBN: 9780134475585
Author: Srikant M. Datar, Madhav V. Rajan
Publisher: PEARSON
expand_more
expand_more
format_list_bulleted
Videos
Textbook Question
Chapter 14, Problem 14.40P
Variance analysis, multiple products. The Robin’s Basket operates a chain of Italian gelato stores. Although the Robin’s Basket charges customers the same price for all flavors, production costs vary, depending on the type of ingredients. Budgeted and actual operating data of its Washington, D.C., store for August 2017 are as follows:
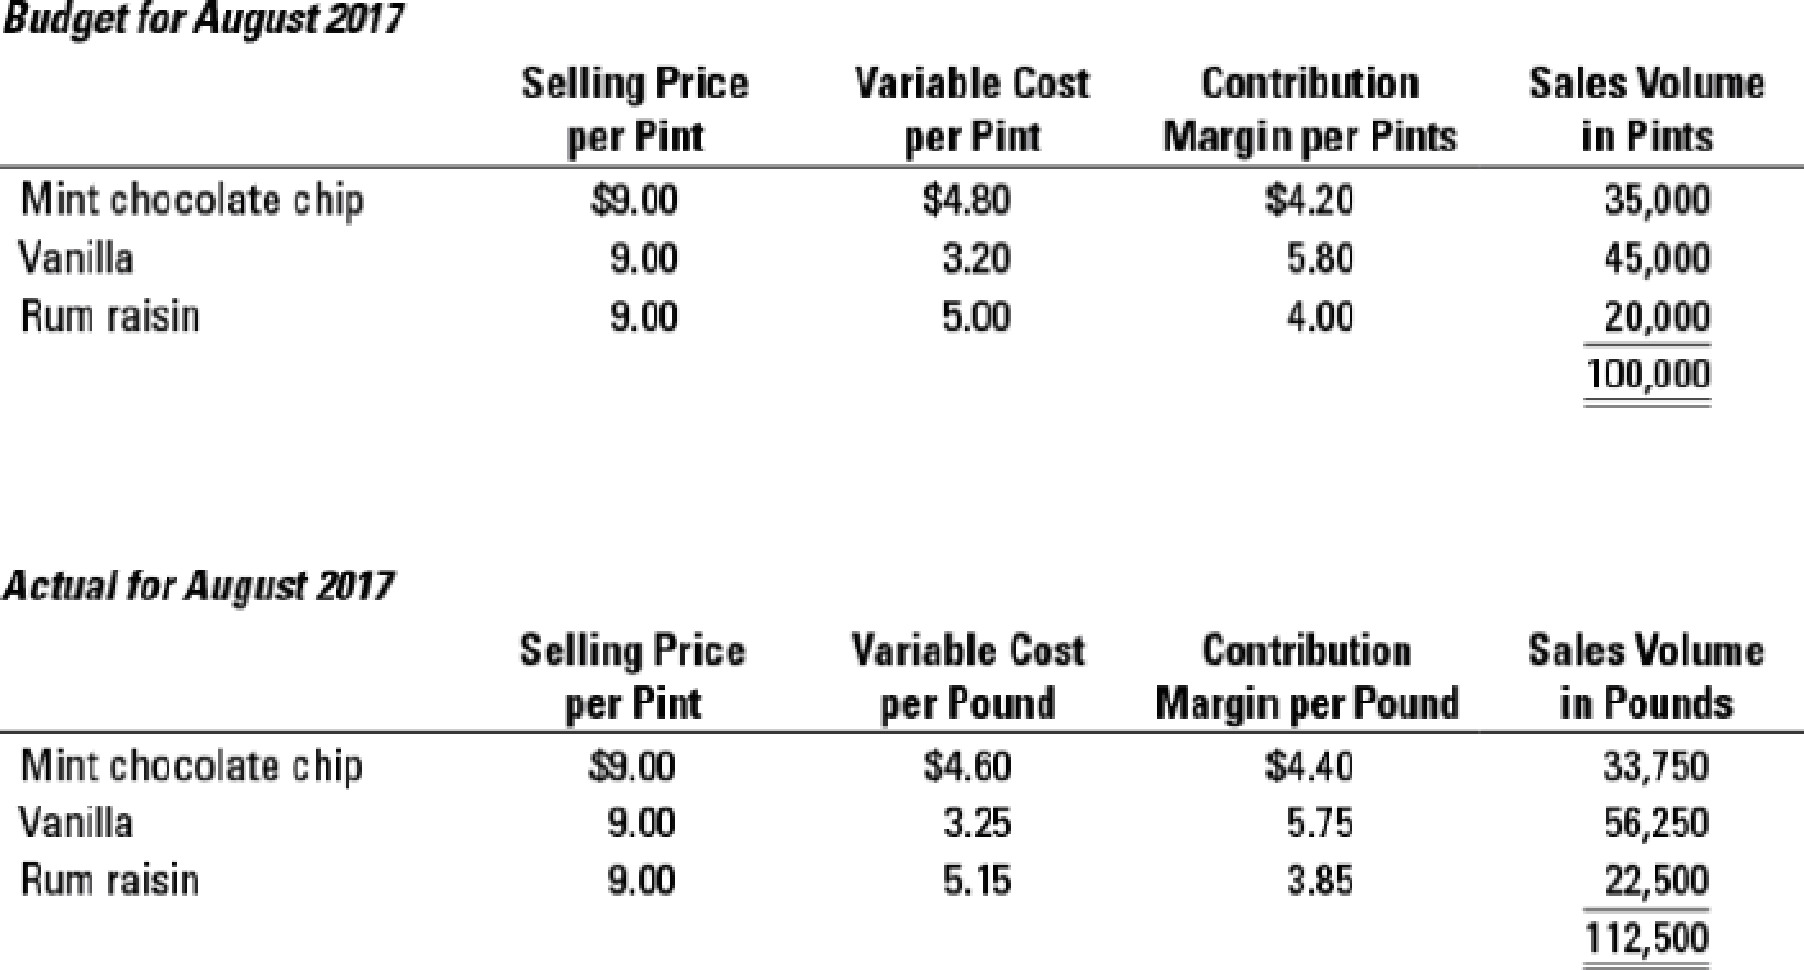
The Robin’s Basket focuses on contribution margin in its variance analysis.
- 1. Compute the total sales-volume variance for August 2017.
Required
- 2. Compute the total sales-mix variance for August 2017.
- 3. Compute the total sales-quantity variance for August 2017.
- 4. Comment on your results in requirements 1, 2, and 3.
Expert Solution & Answer
Want to see the full answer?
Check out a sample textbook solution
Students have asked these similar questions
Variance analysis, multiple products. The Robin’s Basket operates a chain of Italian gelato stores. Although the Robin’s Basket charges customers the same price for all avors, production costs vary, depending on the type of ingredients. Budgeted and actual operating data of its Washington, D.C., store for August 2017 are as follows:
Variance analysis, multiple products. The Robin’s Basket operates a chain of Italian gelato stores. Although the Robin’s Basket charges customers the same price for all flavors, production costs vary, depending on the type of ingredients. Budgeted and actual operating data of its Washington, D.C., store for August 2017 are as follows:
PLEASE ANSWER THE FOLLOWING QUESTIONS:
Requirements
1. Compute the total sales-volume variance, the total sales-mix variance, and
the total sales-quantity variance. (Calculate all variances in terms of
contribution margin.) Show results for each product in your computations.
2. What inferences can you draw from the variances computed in
requirement 1?
Data table
Budget for 2020
Selling Variable Cost Cartons
Product Price per Carton Sold
Kostor $11.00 $
Limba $ 23.00 $
6.40
16.15
Actual for 2020
Selling Variable Cost Cartons
Price per Carton Sold
7.40 138,600
16.35 59,400
132,000 $11.60 S
88,000 $ 24.40 $
Chapter 14 Solutions
Horngren's Cost Accounting: A Managerial Emphasis (16th Edition)
Ch. 14 - Prob. 14.1QCh. 14 - Why is customer-profitability analysis an...Ch. 14 - Prob. 14.3QCh. 14 - A customer-profitability profile highlights those...Ch. 14 - Give examples of three different levels of costs...Ch. 14 - What information does the whale curve provide?Ch. 14 - A company should not allocate all of its corporate...Ch. 14 - What criteria might managers use to guide...Ch. 14 - Once a company allocates corporate costs to...Ch. 14 - A company should not allocate costs that are fixed...
Ch. 14 - How should a company decide on the number of cost...Ch. 14 - Show how managers can gain insight into the causes...Ch. 14 - How can the concept of a composite unit be used to...Ch. 14 - Explain why a favorable sales-quantity variance...Ch. 14 - How can the sales-quantity variance be decomposed...Ch. 14 - Flexible-budget variance, sales-quantity,...Ch. 14 - Sales-volume, sales-mix, and sales-quantity...Ch. 14 - Cost allocation in hospitals, alternative...Ch. 14 - Customer profitability, customer-cost hierarchy....Ch. 14 - Customer profitability, service company. Instant...Ch. 14 - Customer profitability, distribution. Best Drugs...Ch. 14 - Cost allocation and decision making. Reidland...Ch. 14 - Cost allocation to divisions. Rembrandt Hotel ...Ch. 14 - Cost allocation to divisions. Bergen Corporation...Ch. 14 - Prob. 14.25ECh. 14 - Variance analysis, working backward. The Hiro...Ch. 14 - Variance analysis, multiple products. Emcee Inc....Ch. 14 - Market-share and market-size variances...Ch. 14 - Click here to open your MyFinanceLab Study Plan...Ch. 14 - Customer profitability. Bracelet Delights is a new...Ch. 14 - Customer profitability, distribution. Green Paper...Ch. 14 - Customer profitability in a manufacturing firm....Ch. 14 - Customer-cost hierarchy, customer profitability....Ch. 14 - Allocation of corporate costs to divisions. Cathy...Ch. 14 - Cost allocation to divisions. Forber Bakery makes...Ch. 14 - Prob. 14.36PCh. 14 - Cost-hierarchy income statement and allocation of...Ch. 14 - Variance analysis, sales-mix and sales-quantity...Ch. 14 - Market-share and market-size variances...Ch. 14 - Variance analysis, multiple products. The Robins...Ch. 14 - Customer profitability and ethics. KC Corporation...
Knowledge Booster


Learn more about
Need a deep-dive on the concept behind this application? Look no further. Learn more about this topic, accounting and related others by exploring similar questions and additional content below.Similar questions
- Variance analysis, multiple products. Emcee Inc. manufactures and sells two fruit drinks: Kostor and Limba. Budgeted and actual results for 2017 are as follows:arrow_forwardCampbell Industries has gathered the following information about the actual sales revenues and expenses for its pharmaceuticals segment for the most recent year. E (Click the icon to view the actual data.) Prepare a segment margin performance report for the pharmaceutical segment. Calculate a variance and a variance percentage for each line in the report. Round to the nearest hundredth for the variance percentages (for example, if your answer is 16.2384%, round it to 16.24%). Budgeted data for the same time period for the pharmaceutical segment are as follows (all data are in millions): E (Click the icon to view the budgeted data.) Begin by preparing the performance report through the contribution margin line. Next, complete the report through the segment margin line, and then, finally, complete the report through the operating income line. (Enter the variances as positive numbers. Round the variance percentages to the nearest hundredth percent, X.XX%.) Performance Report Data table…arrow_forwardThe Soda Shoppe manufactures and sells three soft drinks: Kola, Lima, and Oranga. Budgeted and actual results for 2022 are as follows: (Click the icon to view the budgeted data.) (Click the icon to view the actual data.) Required 1. Compute the total sales-volume variance, the total sales-mix variance, and the total sales-quantity variance. (Calculate all variances in terms of contribution margin.) Show results for each product in your computations. 2. What inferences can you draw from the variances computed in requirement 1? Requirement 1. Compute the total sales-volume variance, the total sales-mix variance, and the total sales-quantity variance. (Calculate all variances in terms of contribution margin.) Show results for each product in your computations. Begin by computing the actual contribution margins (CM). Then, compute the budgeted contribution margins in dollars for each product and in total for 2022. Actual CM Kola Lima Oranga Total Budgeted data Kola Lima Oranga Budget for…arrow_forward
- Sulert, Inc., produces and sells gel-filled ice packs. Sulert’s performance report for April follows: REQUIRED: 1. Calculate the contribution margin variance and the contribution margin volume variance. 2. Calculate the market share variance and the market size variance. (CMA adapted)arrow_forwardAnalysis of sales variances to develop strategies to improve its profit position is an ongoing exercise at Caribbean Productions Ltd. The company produces and sells three products, Date Prune, and Cashella. The following budgeted and actual results were extracted from the company’s records for the month of January 2017: Budgeted Results Product Total Sales $ Volume/units Price $ Contribution margin per unit $ Total contribution margin $ Date 1,200,000 600 2,000 950 570,000 Prune 1,040,000 800 1,300 620 496,000 Cashella 600,000 600 1,000 500 300,000 2,840,000 2,000 1,366,000 Actual Results Product Total Sales $ Volume/units Price $ Contribution margin per unit $ Total contribution margin $ Date 1,540,000 700 2,200 1,000…arrow_forwardAnalysis of sales variances to develop strategies to improve its profit position is an ongoing exercise at Caribbean Productions Ltd. The company produces and sells three products, Date Prune, and Cashella. The following budgeted and actual results were extracted from the company’s records for the month of January 2017: Budgeted Results Product Total Sales $ Volume/units Price $ Contribution margin per unit $ Total contribution margin $ Date 1,200,000 600 2,000 950 570,000 Prune 1,040,000 800 1,300 620 496,000 Cashella 600,000 600 1,000 500 300,000 2,840,000 2,000 1,366,000 Actual Results Product Total Sales $ Volume/units Price $ Contribution margin per unit $ Total contribution margin $ Date 1,540,000 700 2,200 1,000…arrow_forward
- Question Variance analysis, nonmanufacturing setting. Joyce Brown has run Medical Maids, a specialty cleaning service for medical and dental offices, for the past 10 years. Her static budget and actual results for April 2017 are shown below. Joyce has one employee who has been with her for all 10 years that she has been in business. In addition, at any given time she also employs two other less-experienced workers. It usually takes each employee 2 hours to clean an office, regardless of his or her experience. Brown pays her experienced employee $30 per office and the other two employees $15 per office. There were no wage increases in April. 4. What information, in addition to that provided in the income statements, would you want Brown to gather, if you wanted to improve operational efficiency?arrow_forwardQuestion Variance analysis, nonmanufacturing setting. Joyce Brown has run Medical Maids, a specialty cleaning service for medical and dental offices, for the past 10 years. Her static budget and actual results for April 2017 are shown below. Joyce has one employee who has been with her for all 10 years that she has been in business. In addition, at any given time she also employs two other less-experienced workers. It usually takes each employee 2 hours to clean an office, regardless of his or her experience. Brown pays her experienced employee $30 per office and the other two employees $15 per office. There were no wage increases in April. 1. How many offices, on average, did Brown budget for each employee? How many offices did each employee actually clean? 2. Prepare a flexible budget for April 2017.arrow_forwardQuestion Variance analysis, nonmanufacturing setting. Joyce Brown has run Medical Maids, a specialty cleaning service for medical and dental offices, for the past 10 years. Her static budget and actual results for April 2017 are shown below. Joyce has one employee who has been with her for all 10 years that she has been in business. In addition, at any given time she also employs two other less-experienced workers. It usually takes each employee 2 hours to clean an office, regardless of his or her experience. Brown pays her experienced employee $30 per office and the other two employees $15 per office. There were no wage increases in April. 3. Compute the sales price variance and the labor efficiency variance for each labor type. 4. What information, in addition to that provided in the income statements, would you want Brown to gather, if you wanted to improve operational efficiency?arrow_forward
- Classics, Ltd., details cars. Classics wants to compare this quarter’s results with those for last quarter, which is believed to be typical for operations. Assume that the following information is provided. Last Quarter This Quarter Number of detailings 440 523 Revenues $ 72,160 $ 68,800 Variable costs 27,920 31,920 Contribution margin $ 44,240 $ 36,880 Required: a. Compute the flexible budget and sales activity variance and prepare a profit variance analysis. (Hint: Use last quarter as the master budget and this quarter as “actual.”) b. What impact did the changes in number of detailings and average revenues (i.e., sales price) have on Classics, Ltd.’s contribution margin?arrow_forwardTV Timers, Incorporated, manufactures time control devices for TV's. The firm has the following operating data for its operations in July: Actual market size Budgeted market size Actual market share Budgeted market share Budgeted average contribution margin Actual average contribution margin What is the company's market share variance? A. $1,590 favorable. B. $1,784 favorable. C. $1,740 favorable. D. $2,070 favorable. E. $3,660 favorable. 14,500 16,300 34% 32% $6.00 $5.25arrow_forwardIn analyzing company operations, the controller of the Carson Corporation found a $250,000 favorable flexible budget revenue variance. The variance was calculated by comparing the actual results with the flexible budget. This variance can be wholly explained by: (CMA adapted) Multiple Choice О the total flexible budget variance. О the total static budget variance. О changes in unit selling prices. changes in the number of units sold.arrow_forward
arrow_back_ios
SEE MORE QUESTIONS
arrow_forward_ios
Recommended textbooks for you
 Cornerstones of Cost Management (Cornerstones Ser...AccountingISBN:9781305970663Author:Don R. Hansen, Maryanne M. MowenPublisher:Cengage Learning
Cornerstones of Cost Management (Cornerstones Ser...
Accounting
ISBN:9781305970663
Author:Don R. Hansen, Maryanne M. Mowen
Publisher:Cengage Learning
What is Risk Management? | Risk Management process; Author: Educationleaves;https://www.youtube.com/watch?v=IP-E75FGFkU;License: Standard youtube license