
Concept explainers
Videos
Reminder Round all answers to two decimal places unless otherwise indicated.
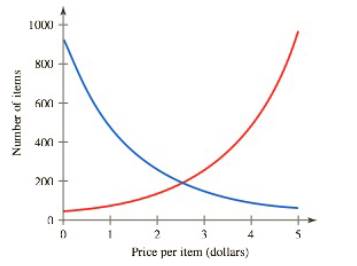
Equilibrium Price This is a continuation of Exorcise 5. The equilibrium price is the price where the supply and demand are the same. In Figure 1.31, the supply curve is in red and the demand curve is in blue. Use this graph to estimate the equilibrium price. How many items are supplied at the equilibrium price?
FIGURE
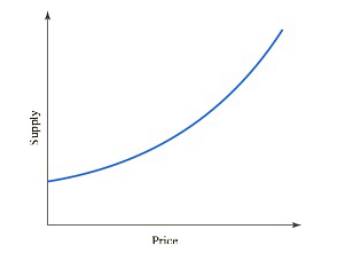
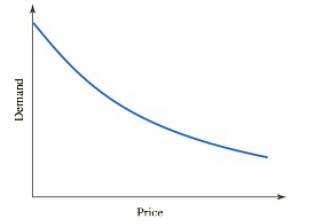
5. Supply and Demand Curves A supply curve is a graph that shows the quantity of a product that is made available by suppliers as a function of the price. Similarly, a demand curve is a graph that shows the quantity of a product that consumers are willing to purchase as a function of the price. Examples of supply and demand curves are shown in Figures
a. Explain in practical terms what the supply curve in Figure
b. Explain in practical terms what the demand curve in Figure 1.30 tells us.
FIGURE
FIGURE
Want to see the full answer?
Check out a sample textbook solution
Chapter 1 Solutions
Functions and Change: A Modeling Approach to College Algebra (MindTap Course List)


- Immigration The following graph shows immigrationin thousand to the United States has varied over the past century. Source: Homeland Security. a. Find the average annual rate of change in immigration for the first half of the century from 1905 to 1955. b. Find the average annual rate of change in immigration for the second half of the century from 1955 to 2005. c. Find the average annual rate of change in immigration for the entire century from 1905 to 2005. d. Average your answers to part a and b, and compare the result with your answer from part c. Will these always be equal for any two time periods? e. If the annual average rate of change for entire century continues, predict the number of immigrants in 2009. Compare answer to the actual number of 1,130,818 immigrants.arrow_forwardSKILL BUILDING EXERCISES Marginal Profit: Your goal is to maximize profit. What value of marginal profit should you seek?arrow_forwardMortgage Rates The following table is taken from the website of Freddie Mac. It shows rates for 30-year fixed-rate mortgages since 1970. y=Year r=Mortgagerate 1975 9.05 1980 13.74 1985 12.43 1990 10.13 1995 7.93 2000 8.05 2005 5.87 2010 4.69 2015 3.84 a. Explain in practical terms the meaning of r(2003). b. Use the table to estimate the value of r(2003).arrow_forward
 Calculus For The Life SciencesCalculusISBN:9780321964038Author:GREENWELL, Raymond N., RITCHEY, Nathan P., Lial, Margaret L.Publisher:Pearson Addison Wesley,
 Algebra and Trigonometry (MindTap Course List)AlgebraISBN:9781305071742Author:James Stewart, Lothar Redlin, Saleem WatsonPublisher:Cengage Learning
 Functions and Change: A Modeling Approach to Coll...AlgebraISBN:9781337111348Author:Bruce Crauder, Benny Evans, Alan NoellPublisher:Cengage Learning
 Glencoe Algebra 1, Student Edition, 9780079039897...AlgebraISBN:9780079039897Author:CarterPublisher:McGraw Hill