
Videos
Immigration The following graph shows immigration(in thousand) to the United States has varied over the past century.
Source: Homeland Security.
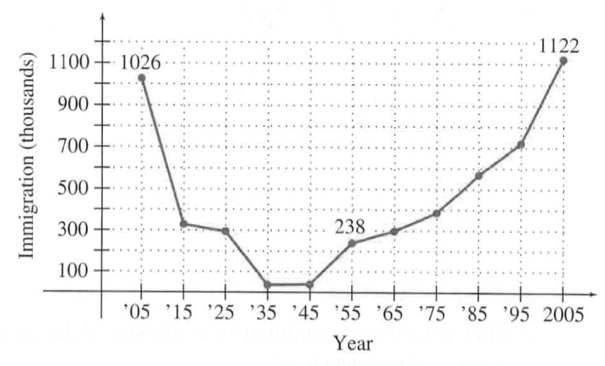
a. Find the average annual rate of change in immigration for the first half of the century (from
b. Find the average annual rate of change in immigration for the second half of the century (from
c. Find the average annual rate of change in immigration for the entire century (from
d. Average your answers to part a and b, and compare the result with your answer from part c. Will these always be equal for any two time periods?
e. If the annual average rate of change for entire century continues, predict the number of immigrants in
Want to see the full answer?
Check out a sample textbook solution
Chapter 3 Solutions
Calculus For The Life Sciences


- Stock Market During the week of June 22, 2009, the closing numbers of the Dow Jones Industrial Average each day were: What was the overall change for the week? Was it positive or negative?arrow_forwardFind the mean hourly cost when the cell phone described above is used for 240 minutes.arrow_forwardDVD Player sales The table shows the number of DVD play-ers sold in a small electronics store in the years 2003-2013. What was the average rate of change of sales between 2003 and 2013? Whatwas the average rate of change of sales between 2003 and 2004? What was the average rate of change of sales between 2004 and 2005? Between which two successive years did DVD player sales increase most quickly?arrow_forward
- Heart Disease In a certain country, the number of deaths due to heart disease decreased from 235 in one year to 221 in the next year. What percentage decrease in deaths due to heart disease does this represent?arrow_forwardFarms in the United States The graph gives the number of farms in the United States from 1850 to 2000. aEstimate the average rate of change in the number of farms between i 1860 and 1890 and ii 1950 and 1970. bIn which decade did the number of farms experience the greatest average rate of decline?arrow_forwardEstimate the age of a newly discovered fossil for which the ratio of carbon-14 to carbon-12 is R=1/1014.arrow_forward
- Enter the data from Table 2 into a graphing calculator and graph the ranking scatter plot. Determine whetherthe data from the table would likely represent a function that is linear, exponential, or logarithmic.arrow_forwardDVD Player Sales The table shows the number of DVD players sold in a small electronics store in the years 2003-2013. Year DVD players sold 2003 495 2004 513 2005 410 2006 402 2007 520 2008 580 2009 631 2010 719 2011 624 2012 582 2013 635 aWhat was the average rate of change of sales between 2003 and 2013? bWhat was the average rate of change of sales between 2003 and 2004? cWhat was the average rate of change of sales between 2004 and 2005? dBetween which two successive years did DVD player sales increase most quickly? Decrease most quickly?arrow_forward
 Algebra and Trigonometry (MindTap Course List)AlgebraISBN:9781305071742Author:James Stewart, Lothar Redlin, Saleem WatsonPublisher:Cengage Learning
 College AlgebraAlgebraISBN:9781305115545Author:James Stewart, Lothar Redlin, Saleem WatsonPublisher:Cengage Learning
 Glencoe Algebra 1, Student Edition, 9780079039897...AlgebraISBN:9780079039897Author:CarterPublisher:McGraw Hill
 Holt Mcdougal Larson Pre-algebra: Student Edition...AlgebraISBN:9780547587776Author:HOLT MCDOUGALPublisher:HOLT MCDOUGAL
 Functions and Change: A Modeling Approach to Coll...AlgebraISBN:9781337111348Author:Bruce Crauder, Benny Evans, Alan NoellPublisher:Cengage Learning