
Concept explainers
Videos
Reminder Round all answers to two decimal places unless otherwise indicated.
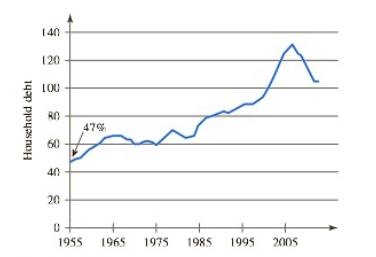
Household Debt The graph in Figure
a. Explain the meaning of
b. The graph reaches a maximum value. Estimate the maximum value and the year in which it occurred.
FIGURE
Want to see the full answer?
Check out a sample textbook solution
Chapter 1 Solutions
Functions and Change: A Modeling Approach to College Algebra (MindTap Course List)
Additional Math Textbook Solutions
High School Math 2015 Common Core Algebra 1 Student Edition Grade 8/9
Beginning and Intermediate Algebra (6th Edition)
College Algebra
Intermediate Algebra for College Students (7th Edition)
Algebra And Trigonometry (11th Edition)


- During what time period would the broker advise buying if he thought 500 to 800 was an appropriate buy range? Example 2.10 Beginning in 2001, the price of gold was modeled approximately by G(t)=2551.18t dollars per ounce, where t is the time in years since the beginning of 2001.arrow_forwardFarms in the United States The graph gives the number of farms in the United States from 1850 to 2000. aEstimate the average rate of change in the number of farms between i 1860 and 1890 and ii 1950 and 1970. bIn which decade did the number of farms experience the greatest average rate of decline?arrow_forwardLIFE SCIENCE APPLICATIONS Gender Ratio The number of males per 100 females, age 65 or over, in the United States for some recent years is shown in the following table. Source: The U.S Census Bureau. Year Males per 100 Females 1960 82.8 1970 72.1 1980 67.6 1990 67.2 2000 70.0 2010 77.0 a. Plot the data, letting x be the years since 1900. b. Would a linear or quadratic function best model this data? Explain. c. If your graphing calculator has a quadratic regression feature, find the quadratic function that best fits the data. Graph this function on the same calculator window as the data. See Example 7c. d. Choose the lowest point in the table above as the vertex and 110,77.0 as a second point to find a quadratic function defined by f(x)=a(xh)2+k that models the data. e. Graph the function from part d on the same calculator window as the data and function from part c. Do the graphs of the two functions differ by much? f. Predict the number of males per 100 females in 2004 using the two functions from parts c and d, and compare with the actual figure of 71.7.arrow_forward
 Calculus For The Life SciencesCalculusISBN:9780321964038Author:GREENWELL, Raymond N., RITCHEY, Nathan P., Lial, Margaret L.Publisher:Pearson Addison Wesley,
 Algebra and Trigonometry (MindTap Course List)AlgebraISBN:9781305071742Author:James Stewart, Lothar Redlin, Saleem WatsonPublisher:Cengage Learning
 Functions and Change: A Modeling Approach to Coll...AlgebraISBN:9781337111348Author:Bruce Crauder, Benny Evans, Alan NoellPublisher:Cengage Learning
 Big Ideas Math A Bridge To Success Algebra 1: Stu...AlgebraISBN:9781680331141Author:HOUGHTON MIFFLIN HARCOURTPublisher:Houghton Mifflin Harcourt
 College AlgebraAlgebraISBN:9781305115545Author:James Stewart, Lothar Redlin, Saleem WatsonPublisher:Cengage Learning
 Glencoe Algebra 1, Student Edition, 9780079039897...AlgebraISBN:9780079039897Author:CarterPublisher:McGraw Hill