
Concept explainers
Videos
Reminder Round all answers to two decimal places unless otherwise indicated.
Relativistic Time A correctly functioning hourglass on board a rocket ship would appear to a stationary observer to take longer than an hour to empty. The graph in Figure
a. Use the graph to estimate the value of
c. Does a small change in velocity cause a greater change in apparent time at slower speeds or at faster speeds?
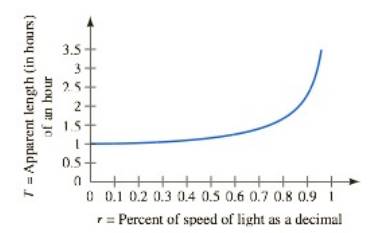
FIGURE 1.50 Relativistic length of an hour
Want to see the full answer?
Check out a sample textbook solution
Chapter 1 Solutions
Functions and Change: A Modeling Approach to College Algebra (MindTap Course List)


- Earthquake the graph shows the vertical acceleration of the Ground from the 1994 Northridge earthquake in Los Angles, as measured by a seismograph. (Here t represents the time in seconds.) (a) At what time t did the earthquake first make noticeable movement of the Earth? (b) At what time t did the earthquakes seem to end? (c) At what time t was the maximum intensity of the earthquake list reachedarrow_forwardLIFE SCIENCE APPLICATIONS Length of a Pendulum Grandfather clocks use pendulums to keep accurate time. The relationship between the length of a pendulum L and the time T for one complete oscillation can be determined from the data in the table. Source: Gary Rockswold. L(ft) T(sec) 1.0 1.11 1.5 1.36 2.0 1.57 2.5 1.76 3.0 1.92 3.5 2.08 4.0 2.22 a. Plot the data from the table with L as the horizontal axis and T as the vertical axis. b. Find the least squares line equation and graph it simultaneously, if possible, with the data points. Does it seem to fit the data? c. Find the correlation coefficient and interpret it. Does it confirm your answer to part b?arrow_forwardImmigration The following graph shows immigrationin thousand to the United States has varied over the past century. Source: Homeland Security. a. Find the average annual rate of change in immigration for the first half of the century from 1905 to 1955. b. Find the average annual rate of change in immigration for the second half of the century from 1955 to 2005. c. Find the average annual rate of change in immigration for the entire century from 1905 to 2005. d. Average your answers to part a and b, and compare the result with your answer from part c. Will these always be equal for any two time periods? e. If the annual average rate of change for entire century continues, predict the number of immigrants in 2009. Compare answer to the actual number of 1,130,818 immigrants.arrow_forward
 Calculus For The Life SciencesCalculusISBN:9780321964038Author:GREENWELL, Raymond N., RITCHEY, Nathan P., Lial, Margaret L.Publisher:Pearson Addison Wesley,
 College AlgebraAlgebraISBN:9781305115545Author:James Stewart, Lothar Redlin, Saleem WatsonPublisher:Cengage Learning
 Algebra and Trigonometry (MindTap Course List)AlgebraISBN:9781305071742Author:James Stewart, Lothar Redlin, Saleem WatsonPublisher:Cengage Learning
 Algebra & Trigonometry with Analytic GeometryAlgebraISBN:9781133382119Author:SwokowskiPublisher:Cengage